Nagiosgrapth - no graphs

Support forum for Nagios Core, Nagios Plugins, NCPA, NRPE, NSCA, NDOUtils and more. Engage with the community of users including those using the open source solutions.
User avatar
setevoy
Posts: 13
Joined: Fri Jul 03, 2015 9:49 am
Location: Kiev, UA
Contact:

Nagiosgrapth - no graphs

Post by setevoy »

Hi.

I have installed Nagiosgraph, manually, with this two HowTos:

http://sourceforge.net/p/nagiosgraph/gi ... ee/INSTALL
http://sachinharma.blogspot.com/2013/08 ... -on_7.html

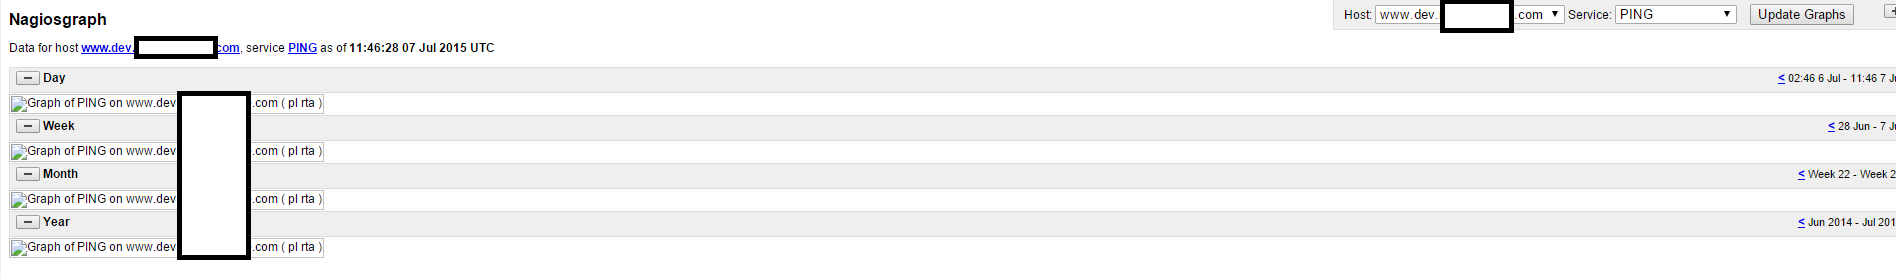
All seems work - but I haven't any real graphs:

Image

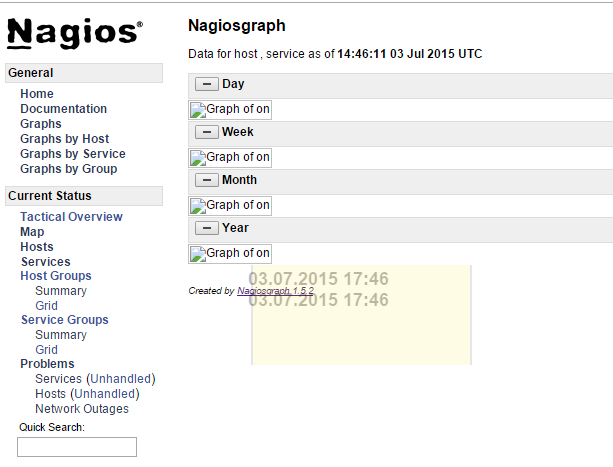
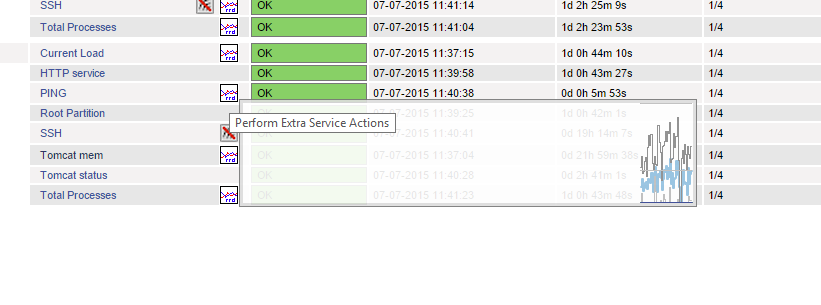
Please, pay attention - there is yellow quadrate - it's selected by mouse, and looks like - there is some "graph", but it won't display.

I have data in rrd directory:

Code: Select all

# rrdtool dump /var/nagios/rrd/www.dev.domain.com/Current%20Load___load1.rrd
<?xml version="1.0" encoding="utf-8"?>
<!DOCTYPE rrd SYSTEM "http://oss.oetiker.ch/rrdtool/rrdtool.dtd">
<!-- Round Robin Database Dump -->
<rrd>
        <version>0003</version>
        <step>300</step> <!-- Seconds -->
        <lastupdate>1435935645</lastupdate> <!-- 2015-07-03 15:00:45 UTC -->

        <ds>
                <name> data </name>
                <type> GAUGE </type>
                <minimal_heartbeat>600</minimal_heartbeat>
                <min>NaN</min>
                <max>NaN</max>
...
No error in logs, etc.

In nagios.cfg:

Code: Select all

...
process_performance_data=1
service_perfdata_file=/var/log/nagios/perfdata.log
service_perfdata_file_template=$LASTSERVICECHECK$||$HOSTNAME$||$SERVICEDESC$||$SERVICEOUTPUT$||$SERVICEPERFDATA$
service_perfdata_file_mode=a
service_perfdata_file_processing_interval=30
service_perfdata_file_processing_command=process-service-graph
...
In templates.cfg:

Code: Select all

define service {
       name graphed-service
       action_url show.cgi?host=$HOSTNAME$&service=$SERVICEDESC$' onMouseOver='showGraphPopup(this)' onMouseOut='hideGraphPopup()' rel='showgraph.cgi?host=$HOSTNAME$&service=$SERVICEDESC$&period=week&rrdopts=-w+450+-j
       register 0
     }
In commands.cfg:

Code: Select all

define command {
       command_name  process-service-graph
       command_line  /bin/perl /usr/local/nagios/libexec/insert.pl
     }
And finally - in host config:

Code: Select all

define service{
        use                             local-service,graphed-service
        host_name                       www.dev.reddotsquare.com
        service_description             Tomcat mem
        check_command                   check-tomcat-mem!8080!admin!Iivoh4pe
        notifications_enabled           1
        }
What I'm doing wrong here?
Last edited by setevoy on Thu Jul 09, 2015 9:51 am, edited 2 times in total.
jolson
Attack Rabbit
Posts: 2560
Joined: Thu Feb 12, 2015 12:40 pm

Re: Nagiosgrapth - no graphs

Post by jolson »

One thing that comes to mind is SELinux - it's possible that it needs to be disabled for this to function properly.

Code: Select all

sestatus
No error in logs, etc.
Which logs? Did you check your apache access log?

Code: Select all

tail /var/log/httpd/access_log
Twits Blog
Show me a man who lives alone and has a perpetually clean kitchen, and 8 times out of 9 I'll show you a man with detestable spiritual qualities.
User avatar
setevoy
Posts: 13
Joined: Fri Jul 03, 2015 9:49 am
Location: Kiev, UA
Contact:

Re: Nagiosgrapth - no graphs

Post by setevoy »

Hi, @jolson

Thanks for your replay.
jolson wrote:One thing that comes to mind is SELinux - it's possible that it needs to be disabled for this to function properly.

Code: Select all

sestatus
SELinux always disabled:

Code: Select all

# sestatus
SELinux status:                 disabled
Which logs? Did you check your apache access log?

Code: Select all

tail /var/log/httpd/access_log
And no related error in NGINX logs - neither /var/log/nginx/nagios-error.log nor /var/log/nginx/error.log.
User avatar
setevoy
Posts: 13
Joined: Fri Jul 03, 2015 9:49 am
Location: Kiev, UA
Contact:

Re: Nagiosgrapth - no graphs

Post by setevoy »

And one more interesting staff - I can see graphs in Services:

Image

But still nothing in any Graphs:

Image
ssax
Dreams In Code
Posts: 7682
Joined: Wed Feb 11, 2015 12:54 pm

Re: Nagiosgrapth - no graphs

Post by ssax »

Start a tail on the access and error logs:

Code: Select all

tail -f /var/log/httpd/error_log /var/log/httpd/access_log
Then open up the page again or refresh and post the output, there should at least be some access_log errors that will give us an indication of what is happening.
User avatar
setevoy
Posts: 13
Joined: Fri Jul 03, 2015 9:49 am
Location: Kiev, UA
Contact:

Re: Nagiosgrapth - no graphs

Post by setevoy »

ssax wrote:Start a tail on the access and error logs:

Code: Select all

tail -f /var/log/httpd/error_log /var/log/httpd/access_log
Then open up the page again or refresh and post the output, there should at least be some access_log errors that will give us an indication of what is happening.

Code: Select all

# tail -f /var/log/nginx/error.log /var/log/nginx/nagios-error.log /var/log/nginx/nagios-access.log
...
194.105.145.69 - nagiosadmin [07/Jul/2015:15:20:05 +0000] "GET /nagios/cgi-bin/show.cgi HTTP/1.1" 200 9008 "http://54.174.182.54/side.php" "Mozilla/5.0 (Windows NT 6.3; WOW64) AppleWebKit/537.36 (KHTML, like Gecko) Chrome/43.0.2357.130 Safari/537.36"
194.105.145.69 - nagiosadmin [07/Jul/2015:15:20:06 +0000] "GET /stylesheets/nagiosgraph.css HTTP/1.1" 304 0 "http://54.174.182.54/nagios/cgi-bin/show.cgi" "Mozilla/5.0 (Windows NT 6.3; WOW64) AppleWebKit/537.36 (KHTML, like Gecko) Chrome/43.0.2357.130 Safari/537.36"
194.105.145.69 - nagiosadmin [07/Jul/2015:15:20:06 +0000] "GET /usr/local/nagios/sbin//showgraph.cgi? HTTP/1.1" 403 25 "http://54.174.182.54/nagios/cgi-bin/show.cgi" "Mozilla/5.0 (Windows NT 6.3; WOW64) AppleWebKit/537.36 (KHTML, like Gecko) Chrome/43.0.2357.130 Safari/537.36"
Here is all I have after opening of `Graphs` page.

Absolutely nothing in `nagios-error.log` or just NGINX's `error.log`.
jdalrymple
Skynet Drone
Posts: 2620
Joined: Wed Feb 11, 2015 1:56 pm

Re: Nagiosgrapth - no graphs

Post by jdalrymple »

Code: Select all

194.105.145.69 - nagiosadmin [07/Jul/2015:15:20:06 +0000] "GET /usr/local/nagios/sbin//showgraph.cgi? HTTP/1.1" 403 25 "http://54.174.182.54/nagios/cgi-bin/show.cgi" "Mozilla/5.0 (Windows NT 6.3; WOW64) AppleWebKit/537.36 (KHTML, like Gecko) Chrome/43.0.2357.130 Safari/537.36"
The 403 there is your clue.

You either have some permissions issues on your nagiosgraph cgi or the authentication directive in your nginx config is hosed up.

ls -l /usr/local/nagios/sbin

and also share with us the location in your nginx.conf relevant to nagiosgraph.
User avatar
setevoy
Posts: 13
Joined: Fri Jul 03, 2015 9:49 am
Location: Kiev, UA
Contact:

Re: Nagiosgrapth - no graphs

Post by setevoy »

jdalrymple wrote:

Code: Select all

194.105.145.69 - nagiosadmin [07/Jul/2015:15:20:06 +0000] "GET /usr/local/nagios/sbin//showgraph.cgi? HTTP/1.1" 403 25 "http://54.174.182.54/nagios/cgi-bin/show.cgi" "Mozilla/5.0 (Windows NT 6.3; WOW64) AppleWebKit/537.36 (KHTML, like Gecko) Chrome/43.0.2357.130 Safari/537.36"
The 403 there is your clue.
Um... Good point, thanks... I didn't noticed this 403...
ls -l /usr/local/nagios/sbin

Code: Select all

# ls -l /usr/local/nagios/sbin/
total 5040
-rwxrwxr-x 1 nagios nagios 310752 Jul  6 09:08 archivejson.cgi
-rwxrwxr-x 1 nagios nagios 292040 Jul  6 09:08 avail.cgi
-rwxrwxr-x 1 nagios nagios 288424 Jul  6 09:08 cmd.cgi
-rwxrwxr-x 1 nagios nagios 259240 Jul  6 09:08 config.cgi
-rwxr-xr-x 1 root   root     6978 Jul  6 09:40 export.cgi
-rwxrwxr-x 1 nagios nagios 300424 Jul  6 09:08 extinfo.cgi
-rwxrwxr-x 1 nagios nagios 255368 Jul  6 09:08 histogram.cgi
-rwxrwxr-x 1 nagios nagios 234664 Jul  6 09:08 history.cgi
-rwxrwxr-x 1 nagios nagios 234664 Jul  6 09:08 notifications.cgi
-rwxrwxr-x 1 nagios nagios 312512 Jul  6 09:08 objectjson.cgi
-rwxrwxr-x 1 nagios nagios 226440 Jul  6 09:08 outages.cgi
-rwxr-xr-x 1 root   root     4945 Jul  6 09:40 show.cgi
-rwxr-xr-x 1 root   root    12045 Jul  6 09:40 showconfig.cgi
-rwxr-xr-x 1 root   root     5198 Jul  6 09:40 showgraph.cgi
-rwxr-xr-x 1 root   root     5016 Jul  6 09:40 showgroup.cgi
-rwxr-xr-x 1 root   root     4940 Jul  6 09:40 showhost.cgi
-rwxrwxr-x 1 nagios nagios 230824 Jul  6 09:08 showlog.cgi
-rwxr-xr-x 1 root   root     4972 Jul  6 09:40 showservice.cgi
-rwxrwxr-x 1 nagios nagios 300232 Jul  6 09:08 status.cgi
-rwxrwxr-x 1 nagios nagios 306560 Jul  6 09:08 statusjson.cgi
-rwxrwxr-x 1 nagios nagios 251368 Jul  6 09:08 statusmap.cgi
-rwxrwxr-x 1 nagios nagios 246984 Jul  6 09:08 statuswml.cgi
-rwxrwxr-x 1 nagios nagios 230728 Jul  6 09:08 statuswrl.cgi
-rwxrwxr-x 1 nagios nagios 255208 Jul  6 09:08 summary.cgi
-rwxrwxr-x 1 nagios nagios 242920 Jul  6 09:08 tac.cgi
-rwxr-xr-x 1 root   root     5297 Jul  6 09:40 testcolor.cgi
-rwxrwxr-x 1 nagios nagios 263592 Jul  6 09:08 trends.cgi
You think - it's because of `root` owner?
I made `chown` to `nagios:nginx` - but this doesn't help.
and also share with us the location in your nginx.conf relevant to nagiosgraph.
Um.. Sorry - could you please clarify this point?
jdalrymple
Skynet Drone
Posts: 2620
Joined: Wed Feb 11, 2015 1:56 pm

Re: Nagiosgrapth - no graphs

Post by jdalrymple »

Code: Select all

GET /usr/local/nagios/sbin//showgraph.cgi
This means you're trying to get the URL "/usr/local/nagios/sbin/showgraph.cgi" - truth be told I'd suspect this means your img src URLs are wonky and that would be in the nagiosgraph config I'd suspect? Your problem reads similar to this guys:

http://sourceforge.net/p/nagiosgraph/di ... /e42f8131/
User avatar
setevoy
Posts: 13
Joined: Fri Jul 03, 2015 9:49 am
Location: Kiev, UA
Contact:

Re: Nagiosgrapth - no graphs

Post by setevoy »

Thanks, @jdalrymple

Problem was in my /opt/nagiosgraph/etc/nagiosgraph.conf.

There was:

Code: Select all

nagiosgraphcgiurl = /usr/local/nagios/sbin/
Instead of:

Code: Select all

nagiosgraphcgiurl = /nagios/cgi-bin
This fixed my problem.
Locked