I have a growing Nagios Core (4.2.1) installation and by the time I will add all the hundreds of servers that we manage it will be huge! Thank you!
Now, cut to the chase. I have posted the same issue to the Nagiosgraph people but I feel it is something to do with Nagios or at least Nagios could be the partial culprit.
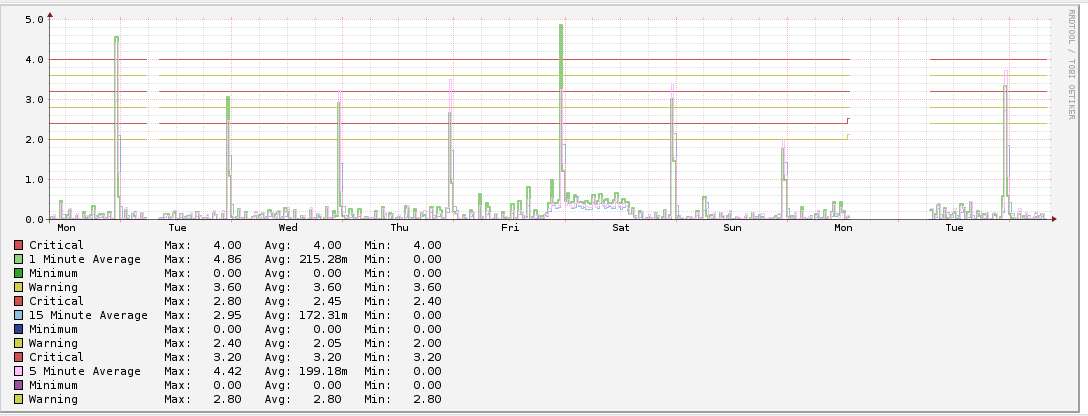
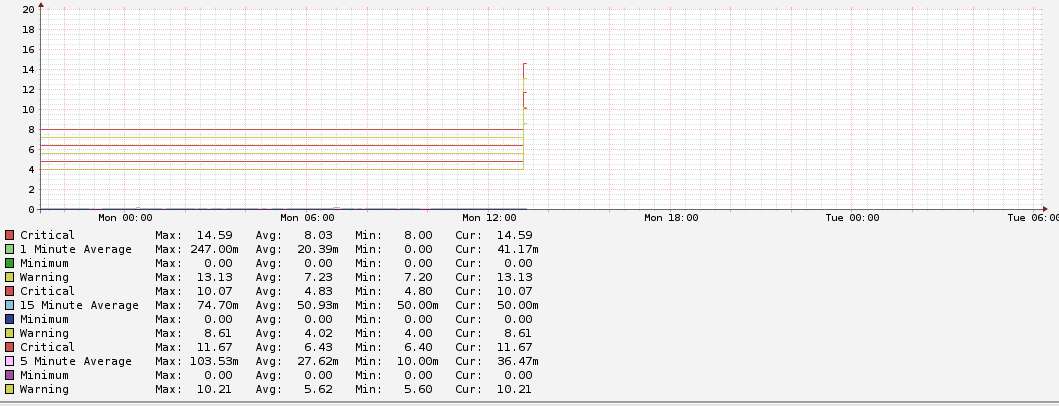
"Hi all, after changing Nagios check interval from 5 minutes to 15 minutes for my load checks Nagiosgraph has stopped writing perf data into the relevant graphs. The same happened for the Windows disk checks when risen to 60 minutes. Every other checks where this value has not being changed are working fine. I double checked every configuration although I have not changed anything. And nothing in the log to point to a particular problem. The RRD files are being updated (time stamps changes), Nagios performs the checks and alerts as normal, it is just that the perf data are not being translated or "transported" into the graphs.
Any help to point me to a solution would be greatly appreciated.
Thanks you."
The above is what I have asked over to the Nagiosgraph help forum.
When I say that the RRD file has been updated that is not really what's happening since the file is 'touched' but there is not data written into it. I double checked by
Code: Select all
rrdtool dump Load___load15.rrd > /home/myhome/load.xmlCode: Select all
            <!-- 2017-02-13 13:10:00 GMT / 1486991400 --> <row><v>2.1212666667e+00</v><v>1.6000000000e+01</v><v>1.9200000000e+01</v><v>0.0000000000e+00</v></row>
            <!-- 2017-02-13 13:15:00 GMT / 1486991700 --> <row><v>2.1817000000e+00</v><v>1.8314666667e+01</v><v>2.1514666667e+01</v><v>0.0000000000e+00</v></row>
            <!-- 2017-02-13 13:20:00 GMT / 1486992000 --> <row><v>NaN</v><v>NaN</v><v>NaN</v><v>NaN</v></row>
            <!-- 2017-02-13 13:25:00 GMT / 1486992300 --> <row><v>NaN</v><v>NaN</v><v>NaN</v><v>NaN</v></row>
The same with the above mentioned Windows Disk Checks.
Now I have commented out the new check_interval (is normal_check_interval deprecated?) and the RRD files and Graph are populated again.
Could anyone shed some light on the issue? It would be nice to use different check intervals for different services but if I don't get valuable graphs then I have to live with the default set-up.
Thank you for your time and help.
Ciao