Page 1 of 1
Grouping pnp4nagios graphs
Posted: Tue Feb 25, 2014 11:47 am
by l1lee
We are currently using nagiosgraph and the subsequent Group By feature that can easily be added to the Trends section of the side bar. We are looking to change to pnp4nagios, but can't find similar functionality. Is there any comparable component for pnp4nagios? i.e. is there a simple way to group graphs of various timeframes of customizable hosts/services, etc for analysis? I would even settle for having the ability to load individual graphs for a given timeframe through a single URL. I haven't been able to find a simple way to accomplish this with pnp4nagios.
Re: Grouping pnp4nagios graphs
Posted: Tue Feb 25, 2014 5:12 pm
by abrist
You should be able to use GET requests to limit the timeframe, host, and service in the pnp interface. Open the pnp interface in a new tab and look at the url. You should see a number of GET request options. Alter those to customize the request.
Re: Grouping pnp4nagios graphs
Posted: Thu Feb 27, 2014 12:07 am
by zoodle
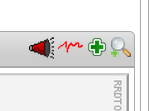
- Screen Shot 2014-02-26 at 9.07.50 PM.png (12.14 KiB) Viewed 2264 times
There's a green plus in the upper right corner of each pnp4nagios graph. Clicking this will add that graph to your "basket" on the right hand sidebar. You can navigate anywhere in pnp4nagios and add graphs to the basket. When you select "show basket" you'll see what you're looking for.
This feature of ad-hoc grouping into a "basket" works great with the "view PDF" feature to give users the ability to make custom reports.
Re: Grouping pnp4nagios graphs
Posted: Thu Feb 27, 2014 4:35 pm
by slansing
Hopefully this is something along the lines of what is being looked for, let us know.