Page 1 of 1
Webtop dashboard
Posted: Tue Aug 26, 2014 7:02 am
by nareshbtech
Dear all
is there a way to display nagios alerts in pi charts based on groups as shown below
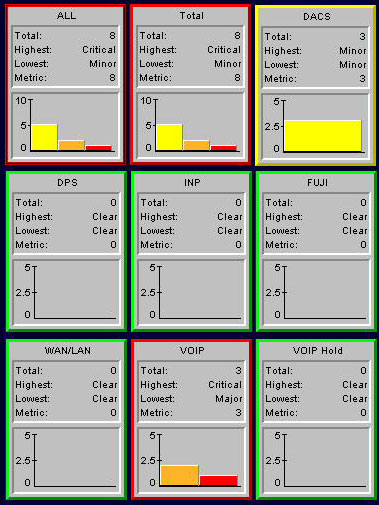
please guide me
thanks
Moderator Note: I have moved your thread to the Nagios Core section
Re: Webtop dashboard
Posted: Tue Aug 26, 2014 9:53 am
by nareshbtech
i found this wil get the data but will be an amature way
write a custom php were we graph the data that fetched from status.cgi
i am able to see the data of service totals with the filter of hostgoroup
http://nagios-host/nagios/cgi-bin/statu ... nux-server
and extract the values from the table
td class='serviceTotalsOK'>3381
td class='serviceTotalsWARNING'>57
td class='serviceTotalsUNKNOWN'>93
td class='serviceTotalsCRITICAL'>441
td class='serviceTotals'>0
whwere we can graph this data using any plotter
but by this way we are fetching full html page is there a better way to do this
please suggest
thank you
Re: Webtop dashboard
Posted: Tue Aug 26, 2014 4:47 pm
by sreinhardt
Are you on core 4.0.x? If so, you can certainly use the json interface. Otherwise scraping web pages, status.dat or retention.dat are about the options you have, unless you want to write C to build into a new module for core.
Re: Webtop dashboard
Posted: Tue Aug 26, 2014 4:49 pm
by abrist
Just to reinforce Spenser's suggestion: The JSON CGIs are the one true way (among others

). If you have core 4, browse to the following url to play with the GET query options:
Code: Select all
http://<nagios ip>/nagios/jsonquery.html
Re: Webtop dashboard
Posted: Thu Aug 28, 2014 3:17 am
by nareshbtech
Thanx abrait , sreinhardt
i have used scrapping method as fo now should impriove min
here is my script with makes the data.csv where we have the alert summuray data
Code: Select all
#! /usr/bin/env python
import urllib2
import sys
import csv
from bs4 import BeautifulSoup
SERVER = sys.argv[1]
authinfo = urllib2.HTTPPasswordMgrWithDefaultRealm()
authinfo.add_password(None, SERVER, 'nagiosadmin', 'xxxxx')
page = sys.argv[1]
handler = urllib2.HTTPBasicAuthHandler(authinfo)
myopener = urllib2.build_opener(handler)
opened = urllib2.install_opener(myopener)
output = urllib2.urlopen(page)
soup = BeautifulSoup(output)


table = soup.find("table", { "class" : sys.argv[2] })
headers = [header.text for header in table.find_all('th')]
rows = []
for row in table.find_all('tr'):
      rows.append([val.text.encode('utf8') for val in row.find_all('td')])

with open('data.dat', 'wb') as f:
     writer = csv.writer(f)
     writer.writerow(headers)
     writer.writerows(row for row in rows if row)


with open('data.dat') as f:
    reader = csv.reader(f)
    cols = []
    for row in reader:
        cols.append(row)

with open('data.csv', 'wb') as f:
    writer = csv.writer(f)
    for i in range(len(max(cols, key=len))):
        writer.writerow([(c[i] if i<len(c) else '') for c in cols])
in this script i pass two variables one is the URL and other is the group
now to genereate the graph i am using gnuplot
Code: Select all
#!/usr/bin/gnuplot
reset
set terminal png
set yrange [0:]
set style fill solid
set boxwidth 1 absolute
set xtic scale 0
set datafile separator ","
set term png
set output hist
upROW(x,y)=(x eq "Up") ? y:1/0
UnrROW(x,y) =(x eq "Unreachable") ? y:1/0
dwnROW(x,y) =(x eq "Down") ? y:1/0
PenROW(x,y) =(x eq "Pending") ? y:1/0
plot data u ($0):(PenROW(stringcolumn(1),$2)):xtic(1) w boxes lc rgb "gray" ti "pen" , '' u ($0):(UnrROW(stringcolumn(1),$2)):xtic(1) w boxes lc rgb "black" ti "UnRch" , '' u ($0):(dwnROW(stringcolumn(1),$2)):xtic(1) w boxes lc rgb "red" ti "Down"
the output is
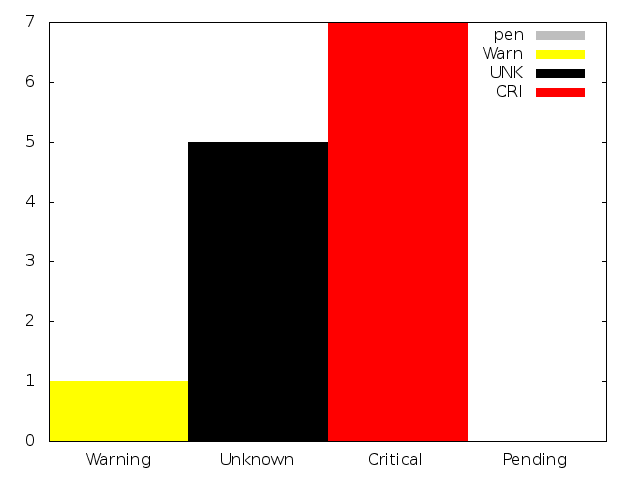
Thank you any suggestions are helpfull
Re: Webtop dashboard
Posted: Fri Aug 29, 2014 1:21 pm
by slansing
What is your next question? It looks like you are plotting it fine, are you having troubles with something else? I'm not sure what you are using in your initial image, if that is what you are trying to re-produce.
Re: Webtop dashboard
Posted: Sun Aug 31, 2014 7:11 am
by nareshbtech
Hi, slansing
Thx yes the present setups if fine
but i just want to provide a solution for any one who refers this port in future
and my next target is to display alerts from the past defined time (say 24hrs) to have more granularity
and hence i think i have to use jason status cgi with filters "Host Time Field" set to "laststatechanve"
the issue is when i give the start and end time its not tatking the values
Program_start": 1408733527000,
"last_data_update": 1409486951000
acc to the jason querry the format should be "MM-DD-YYYY HH:MI" but now working any suggestions
[link removed]
Re: Webtop dashboard
Posted: Tue Sep 02, 2014 5:20 pm
by abrist
Those values seem a bit big for unix time (in seconds). You most likely need to divide them by 1000 before submitting the time (as javascript timestamps are is ms instead of secs).
Re: Webtop dashboard
Posted: Thu Sep 18, 2014 5:56 am
by nareshbtech
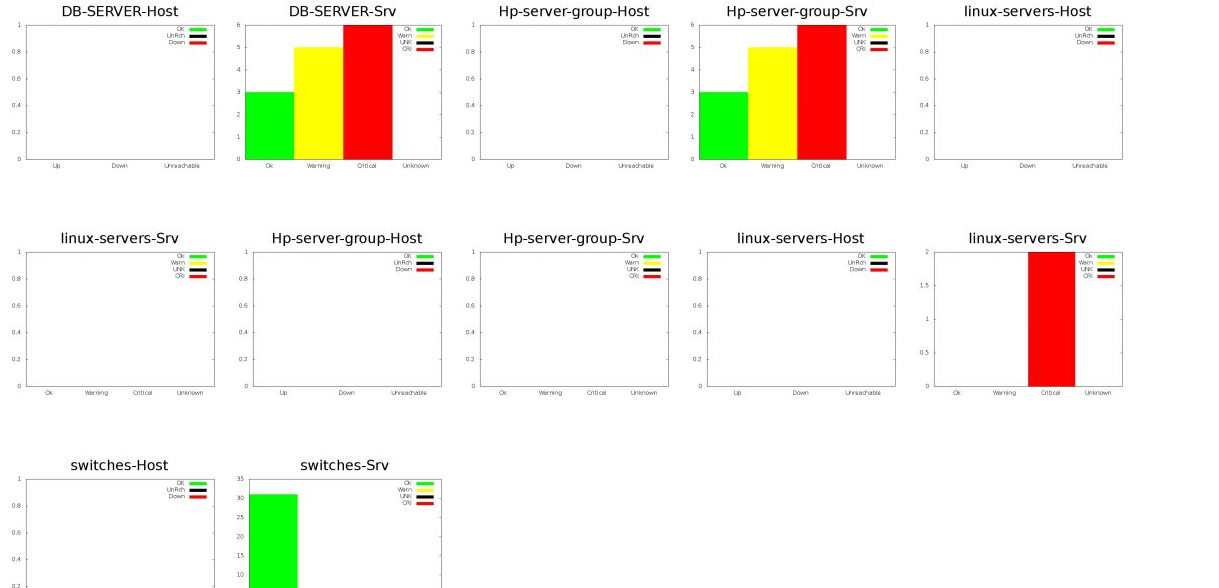
as discussed used json status cgi to get the same values
the script is similar and the time stamps are generated for the past 6 hrs
now=`date +%s`
prev=`date -d "6 hours ago" +%s`
python jason.py "http://$f1/nagios/cgi-bin/statusjson.cgi?query=hostcount&hostgroup=$f2&hosttimefield=lasthardstatechange&starttime=$prev&endtime=$now"
cat jason.py
#!/usr/bin/python
import urllib2
import csv, json, sys
SERVER = sys.argv[1]
authinfo = urllib2.HTTPPasswordMgrWithDefaultRealm()
authinfo.add_password(None, SERVER, 'nagiosadmin', 'xxxxxxxxxxx')
page = SERVER
handler = urllib2.HTTPBasicAuthHandler(authinfo)
myopener = urllib2.build_opener(handler)
opened = urllib2.install_opener(myopener)
output = urllib2.urlopen(page)
html = output.read()
with open("Output.txt", "w") as text_file:
text_file.write(html)
Re: Webtop dashboard
Posted: Thu Sep 18, 2014 4:02 pm
by abrist
Time/date objects in Javascript include the milliseconds. The cgis use seconds for GET args. So when you eval the json from the cgis, it will use mills, but when you submit a time back, you need to divide by 1000.
What are the current issues?