Page 1 of 1
Custom Performance data
Posted: Tue Apr 03, 2012 1:14 am
by nizaroch
Hello,
Please help, I'm having difficulty getting check_load graph correctly, I'm wondering why the graph Y-axis is showing figures with letter 'm' on it and even the min,max,avg, cur shows the same.
Please advise. thanks.
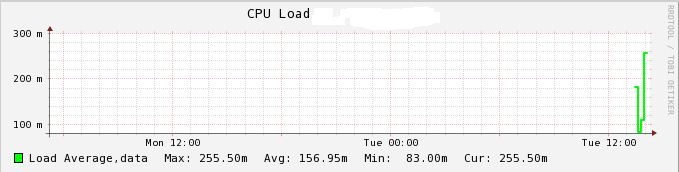
- CPU load graph output.
- LoadAverage.JPG (45.88 KiB) Viewed 2108 times
Re: Custom Performance data
Posted: Thu Apr 19, 2012 1:38 am
by nizaroch
I got it right at last.

Re: Custom Performance data
Posted: Sun Apr 22, 2012 10:59 pm
by nizaroch
Hi Guys,
Is there a way to extend performance data output? my check_disk space plugin output give 13 filesystem, when it comes to performance data output it only shows 7 filesystem as well as in the graph.
Can someone help me on this?
Thanks!
Re: Custom Performance data
Posted: Mon Apr 23, 2012 10:06 am
by agriffin
There are two places things might be going wrong here. It might be the plugin's fault, not printing correct output. Can you post the output you get after running it on the command line?
It could also be going wrong on Nagios' end somewhere. If the output is longer than 8kB Nagios will ignore the rest. You could increase this limit by recompiling Nagios but it might be a better idea to split this check into multiple services instead.
Re: Custom Performance data
Posted: Mon Apr 23, 2012 9:17 pm
by nizaroch
Thanks for the reply. You are right nagios only reads 8kb of nagios plugin output. How do I recompile nagios? do I also need to recomple nagios-plugins as well?
Re: Custom Performance data
Posted: Mon Apr 23, 2012 10:21 pm
by nizaroch
I've tried to recompile nagios from scratch still getting same perfdata output, it doesn't show the complete performance data.
Re: Custom Performance data
Posted: Wed Apr 25, 2012 12:37 pm
by agriffin
Before recompiling, you need to change the value of the MAX_PLUGIN_OUTPUT_LENGTH constant in the nagios.h file.