Page 1 of 2
Generating Reports
Posted: Fri Nov 22, 2019 9:54 am
by tssnagiosadmin
Hello,
Need your assistance for the following:
1. Generate monthly reports for SLA, CPU, memory and storage utilization
2. Store reports for historical viewing. For example, we should be able to retain the monthly reports for a year.
Regards,
TSS
Re: Generating Reports
Posted: Fri Nov 22, 2019 3:13 pm
by mbellerue
Is this for XI Standard or Enterprise?
The best way to keep reports around would be to download them when you generate them, and store them somewhere that people who need them can access them.
Re: Generating Reports
Posted: Fri Nov 22, 2019 7:26 pm
by tssnagiosadmin
mbellerue wrote:Is this for XI Standard or Enterprise?
We are using Enterprise.
We just follow the How to document for Generating Reports With Nagios-XI
https://assets.nagios.com/downloads/nag ... ios-XI.pdf
Just a clarification, we can generate reports based on the selected period (eg. daily, weekly, monthly, yearly report) and it can be automatically send based on the selected frequency? In addition, is there a way on the system we can store reports (Nagios VM)?, if yes how?
Regards,
TSS
Re: Generating Reports
Posted: Mon Nov 25, 2019 11:04 am
by scottwilkerson
tssnagiosadmin wrote:Just a clarification, we can generate reports based on the selected period (eg. daily, weekly, monthly, yearly report) and it can be automatically send based on the selected frequency?
Yes, if you schedule a report using one of those settings it will use the selected setting every time the report is sent.
tssnagiosadmin wrote:In addition, is there a way on the system we can store reports (Nagios VM)?, if yes how?
Nagios XI does not contain an option like this.
Re: Generating Reports
Posted: Fri Dec 13, 2019 9:50 am
by tssnagiosadmin
Hello,
We are now able to received the reports however, we encountered several issues:
1. When we received reports they are resetting time to 4 hours even when we select it as last month in time period section.
2. Suddenly we are not receiving any email alerts after some settings were changed. Upon checking the eventman.log we see this on the logs.
Code: Select all
.......PROCESS EVENT: ID=713651, SOURCE=2, TYPE=1, TIME=2019-12-13 22:41:25
*** GLOBAL HANDLER...
Array
(
    [event_id] => 713651
    [event_source] => 2
    [event_type] => 1
    [event_time] => 2019-12-13 22:41:25
    [event_meta] => Array
        (
            [handler-type] => service
            [host] => AZISGTEZRDBS01
            [service] => CPU Usage
            [hostaddress] => AZISGTEZRDBS01
            [hoststate] => UP
            [hoststateid] => 0
            [hosteventid] => 36958
            [hostproblemid] => 0
            [servicestate] => OK
            [servicestateid] => 0
            [lastservicestate] => CRITICAL
            [lastservicestateid] => 2
            [servicestatetype] => HARD
            [currentattempt] => 5
            [maxattempts] => 5
            [serviceeventid] => 50390
            [serviceproblemid] => 21588
            [serviceoutput] => CPU Load 6% (5 min average)
            [longserviceoutput] =>
            [servicedowntime] => 0
        )

    [logging_enabled] => 1
)
*** GLOBAL HANDLER (snmptrapsender)...
Array
(
    [event_id] => 713651
    [event_source] => 2
    [event_type] => 1
    [event_time] => 2019-12-13 22:41:25
    [event_meta] => Array
        (
            [handler-type] => service
            [host] => AZISGTEZRDBS01
            [service] => CPU Usage
            [hostaddress] => AZISGTEZRDBS01
            [hoststate] => UP
            [hoststateid] => 0
            [hosteventid] => 36958
            [hostproblemid] => 0
            [servicestate] => OK
            [servicestateid] => 0
            [lastservicestate] => CRITICAL
            [lastservicestateid] => 2
            [servicestatetype] => HARD
            [currentattempt] => 5
            [maxattempts] => 5
            [serviceeventid] => 50390
            [serviceproblemid] => 21588
            [serviceoutput] => CPU Load 6% (5 min average)
            [longserviceoutput] =>
            [servicedowntime] => 0
        )

    [logging_enabled] => 1
)
SNMP TRAP SENDER NOT CONFIGURED!
...........
PROCESSED 1 EVENTS
......................
PROCESSED 0 EVENTS
...................
PROCESSED 0 EVENTS
....................
PROCESSED 0 EVENTS
....................
PROCESSED 0 EVENTS
....................
PROCESSED 0 EVENTS
.....[root@sgisgnagtstrm01 var]#
Regards,
TSS
Re: Generating Reports
Posted: Fri Dec 13, 2019 12:42 pm
by lmiltchev
1. When we received reports they are resetting time to 4 hours even when we select it as last month in time period section.
Do you mean the reports are resetting to "4 hours" or the "default" option (Last 24 Hours)?
Can we get some more details on how exactly you scheduled your report? Are you scheduling one of the "pre-build" reports in XI, e.g. Availability, SLA, etc. or you are scheduling a page?
When you go to Reports > My Scheduled Reports, and click on the "View" actions button (the blue arrow), what is the time period that you see - "Last Month" or "Last 24 Hours"?
Have you tried deleting the report, and re-adding it to see if this is going to fix your issue?
2. Suddenly we are not receiving any email alerts after some settings were changed. Upon checking the eventman.log we see this on the logs.
Please open a new thread in order to keep things organized, as this is a different issue. Describe in details what settings have you changed on the system before notifications stopped working for you. Many time, you can find a solution to notification problems in our KB article on the topic:
https://support.nagios.com/kb/article/n ... ms-36.html
Let us know if you already went through all of the steps, outlined in the article above.
Re: Generating Reports
Posted: Mon Dec 16, 2019 11:32 am
by tssnagiosadmin
Are you scheduling one of the "pre-build" reports in XI, e.g. Availability, SLA, etc. or you are scheduling a page?
Both, we use the pre-build reports in XI just for Availability and SLA and it works fine. However, when we tried the scheduling a page report using metrics and add it in new scheduled page it automatically reset the time period to "4 hours" instead of "last month".
For the email notification, I just did a test mail in Nagios (using the pre-build reports) and it works fine however, when I tried to send a test mail using the customize scheduling page reports it didn't sent anyway.
Have you tried deleting the report, and re-adding it to see if this is going to fix your issue?
Yes, but it didn't work in scheduling page report.
Please open a new thread in order to keep things organized, as this is a different issue. Describe in details what settings have you changed on the system before notifications stopped working for you..
Okay, we'll open a new thread for this. But to clarify things up, no modification made in SMTP, email setting, notification or in OS level. We just do modification on the scheduled page after we add a customize report.
Re: Generating Reports
Posted: Mon Dec 16, 2019 1:57 pm
by lmiltchev
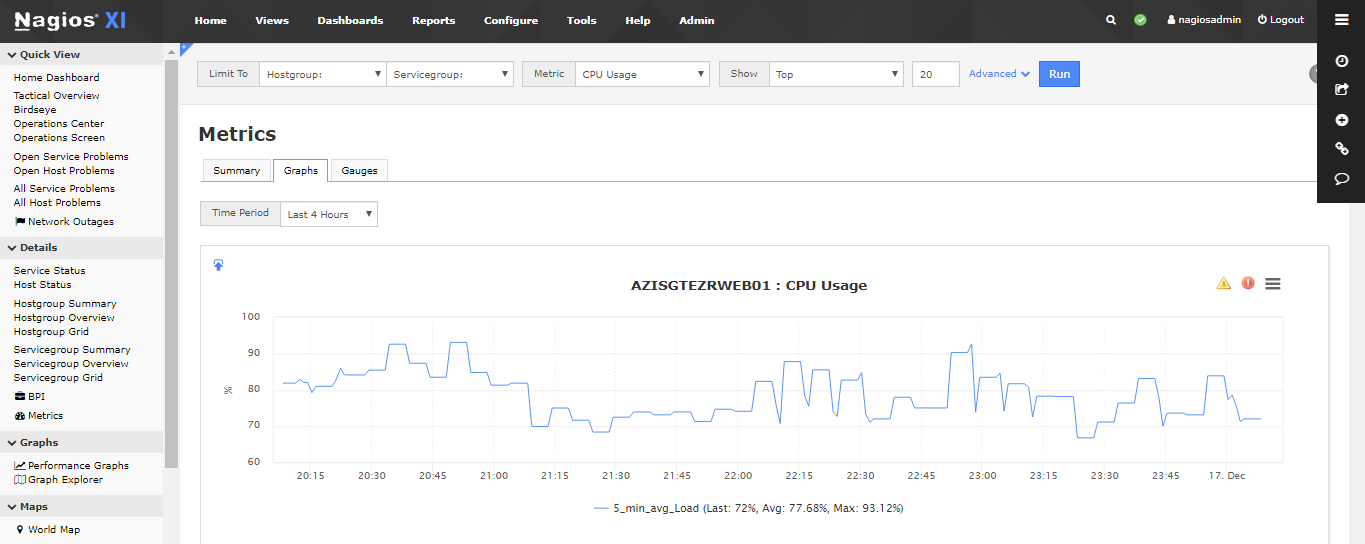
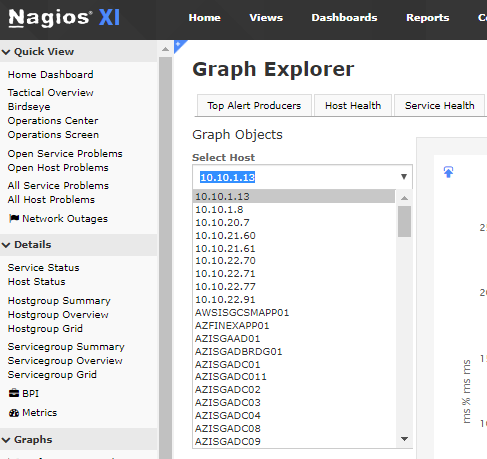
I was able to recreate the problem, when scheduling a page under the Metrics component, and will be filing an internal bug report on the issue. I would recommend that you schedule your pages (graphs) under the Graph Explorer.
example01.PNG
You can click on the "dashify" icon in the upper left corner, and add your graph to a dashboard. Then, you can go to Dashboards > <your dashboard>, and schedule the page from there. Let us know if this method worked for you.
Note: You could also add a graph to a dashboard by going to Home > Graphs > Performance Graphs, and clicking on the "dashity" icon. Under the "Performance Graphs" page, you won't have "Last month" option though - you would have "Last 30 days".
Re: Generating Reports
Posted: Mon Dec 16, 2019 5:13 pm
by tssnagiosadmin
You can click on the "dashify" icon in the upper left corner, and add your graph to a dashboard. Then, you can go to Dashboards > <your dashboard>, and schedule the page from there. Let us know if this method worked for you.
I tried it and it works. I was able to received the generated report. But, it is not giving me an option to select all the host. It seems I need to manually add each hosts to dashboard?
Re: Generating Reports
Posted: Tue Dec 17, 2019 10:56 am
by tssnagiosadmin
I was able to recreate the problem, when scheduling a page under the Metrics component, and will be filing an internal bug report on the issue. I would recommend that you schedule your pages (graphs) under the Graph Explorer.
Noted on this. Can we also get an update when will it fix? Metrics component was easy to use when scheduling report since there's an option to generate reports for all hosts.
