This KB article is about the MySQL / MariaDB database and adjusting the maximum connections allowed. This can be required in larger XI installations.
Historically MySQL has been the database used by Nagios XI, however in CentOS 7 & Debian 9 onwards MariaDB is used instead of MySQL. MariaDB is simply a fork of the MySQL database however some of the command differ slightly. This document will highlight the different commands for each scenario.
This KB article applies to Nagios XI implementations that have the database server on the same server as Nagios XI (default) OR if you have offloaded the database server to an external server.
This KB article covers three topics:
Generally you'll be reading this article because you may have noticed events like this in your log files:
PHP Warning: mysql_connect(): Too many connections
By default, the database server allows 151 connections. You can determine the current maximum allowed connections using this command:
mysql -uroot -pnagiosxi -e "show variables like 'max_connections';"
The output will be something like this:
+-----------------+-------+
| Variable_name   | Value |
+-----------------+-------+
| max_connections | 151   |
+-----------------+-------+
How do you know if you need to increase this value? We can run another query that shows us what the peak number of connections has been since the database server daemon was started:
mysql -uroot -pnagiosxi -e "show global status like 'Max_used_connections';"
The output will be something like this:
+----------------------+-------+
| Variable_name        | Value |
+----------------------+-------+
| Max_used_connections | 65    |
+----------------------+-------+
If the number returned is the same as (or close to max_connections) then you need to increase the allowed number of max_connections.
If you have an offloaded database server, execute those commands on the offloaded database server.
Increasing Max Connections
In this example we are going to define max_connections at 1000.
It has been observed that MariaDB can only have it's max_connections= set to a maximum of 818. If you use any value greater MariaDB will default back to a value of 214. In the steps below if you are using MariaDB you should use 818 instead of 1000.
On your Nagios XI server OR your offloaded database server, edit the config file with the following command:
RHEL | CentOS | Oracle Linux
vi /etc/my.cnf
RHEL 8 | CentOS 8 | Centos Stream
vi /etc/my.cnf.d/mysql-server.cnf
Ubuntu 16/18/20
vi /etc/mysql/mysql.conf.d/mysqld.cnf
Debian 9/10
vi /etc/mysql/mariadb.conf.d/50-server.cnf
When using the vi editor, to make changes press i on the keyboard first to enter insert mode. Press Esc to exit insert mode.
Add the following lines in the section [mysqld]
max_connections=1000
open_files_limit = 4096
If the lines already exists, simply change the value to a higher number.
When you have finished, save the changes in vi by typing:
:wq
and press Enter.
Now execute the following commands (three sets of commands required):
RHEL | CentOS | Oracle Linux | Debian | Ubuntu
systemctl stop nagios.service
systemctl stop ndo2db.service (Nagios 5.6 and lower only)
RHEL 7| CentOS 7| Oracle Linux 7| Debian 9/10
systemctl restart mariadb.service
RHEL 8| CentOS 8| Oracle Linux 8 | Centos Stream
systemctl restart mysqld.service
Ubuntu 16/18/20
systemctl restart mysql.service
RHEL| CentOS | Oracle Linux | Debian | Ubuntu 16/18/20
systemctl start ndo2db.service (Nagios XI 5.6 or lower only)

systemctl start nagios.service
Once you have performed these steps, you can execute the commands outlined in the Identifying Connections section of this KB article to ensure the changes have applied.
Ongoing Monitoring
Now that you have made the changes, you should create some Nagios services to monitor the connections. This will allow you to observe the changes you have made as you may need to increase them again in the future.
There are two different metrics we will monitor:
Max_used_connections
Threads_connected
The number of currently open connections
The services will generate performance graphs, which will help identify trends.
First, we need to create a user account in the database server that can access these metrics. This read only account will not be granted access to any of the databases, it is simply used to query the information_schema internal database.
In the following commands, the username is readonly and the password is readonly_password
Nagios XI Server
echo "CREATE USER 'readonly'@'localhost' IDENTIFIED BY 'readonly_password';" | mysql -u root -p'nagiosxi'
Newer versions of MYSQL the performance_schema table needs to be used and the grants for the readonly user for the performance_schema has to be added by running this command.
echo "GRANT SELECT ON performance_schema.* TO 'readonly'@'localhost';" |mysql -u root -pxxxxxxxxxxxxxxx
Offloaded Database Server:
If you have an offloaded database server, you will need to run this command instead. This command uses 10.25.5.2 as the IP address of the Nagios XI server. You will need to change this to the IP address of your Nagios XI server.
echo "CREATE USER 'readonly'@'10.25.5.2' IDENTIFIED BY 'readonly_password';" | mysql -u root -p'nagiosxi'
Newer versions of MYSQL the performance_schema table needs to be used and the grants for the readonly user for the performance_schema has to be added by running this command.
echo "GRANT SELECT ON performance_schema.* TO 'readonly'@'10.25.5.2';" |mysql -u root -pxxxxxxxxxxxxxxx
Now we can test the plugin commands before creating the services. Nagios XI comes bundled with the check_mysql_query plugin which will be used for the services.
This command checks the Max_used_connections and has the critical threshold of 1000:
Newer versions of MYSQL the performance_schema table needs to be used so update this option from
-d information_schema
to
-d performance_schema
In the following examples and for the $ARG2$ examples below.
Nagios XI Server
/usr/local/nagios/libexec/check_mysql_query -u readonly -preadonly_password -d information_schema -q "select variable_value from global_status where Variable_name='Max_used_connections'" -c :1000
Nagios XI Server Connecting To Remote Database Server:
/usr/local/nagios/libexec/check_mysql_query -H offloaded_server -u readonly -preadonly_password -d information_schema -q "select variable_value from global_status where Variable_name='Max_used_connections'" -c :1000
The output will be something like this:
QUERY OK: 'select variable_value from global_status where Variable_name='Max_used_connections';' returned 67.000000 | result=67.000000;;1000.000000;
This command checks the Threads_connected and has the warning threshold of 900:
Nagios XI Server
/usr/local/nagios/libexec/check_mysql_query -u readonly -preadonly_password -d information_schema -q "select variable_value from global_status where Variable_name='Threads_connected'" -w :900
Nagios XI Server Connecting To Remote Database Server:
/usr/local/nagios/libexec/check_mysql_query -H offloaded_server -u readonly -preadonly_password -d information_schema -q "select variable_value from global_status where Variable_name='Threads_connected'" -w :900
The output will be something like this:
QUERY OK: 'select variable_value from global_status where Variable_name='Threads_connected';' returned 42.000000 | result=42.000000;900.000000;;
After testing that both of those commands worked, the next step is to create the services in Nagios XI.
Click the Configure menu
Click Core Configuration Manager
In the left pane under Commands click Commands
Click the +Add New button
Populate the fields as follows:
| Command Name | check_mysql_query |
| Command Line | $USER1$/check_mysql_query $ARG1$ $ARG2$ $ARG3$ |
| Command Type | check command |
| Active | Checked |
Click Save
In the left pane under Monitoring click Services
Click the +Add New button
This is for Max_used_connections
Populate the fields on each tab as follows:
Common Settings
| Config Name | localhost |
| Description | Database Max_used_connections |
| Manage Hosts button | Select localhost |
| Manage Templates button | Select xiwizard_mysqlquery_service |
| Active | checked |
| Check command | check_mysql_query |
| $ARG1$ | -u readonly -p'readonly_password' |
| $ARG2$ | -d information_schema -q "select variable_value from global_status where Variable_name='Max_used_connections'" |
| $ARG3$ | -c :1000 |
Check Settings
| Check interval | 15 |
| Retry interval | 5 |
| Max check attempts | 6 |
| Check period | xi_timeperiod_24x7 |
Alert Settings
Complete any notification options as required
Click Save
Click the +Add New button
This is for Threads_connected
Populate the fields on each tab as follows:
Common Settings
| Config Name | localhost |
| Description | Database Threads_connected |
| Manage Hosts button | Select localhost |
| Manage Templates button | Select xiwizard_mysqlquery_service |
| Active | checked |
| Check command | check_mysql_query |
| $ARG1$ | -u readonly -p'readonly_password' |
| $ARG2$ | -d information_schema -q "select variable_value from global_status where Variable_name='Threads_connected'" |
| $ARG3$ | -w :900 |
Check Settings
| Check interval | 15 |
| Retry interval | 5 |
| Max check attempts | 6 |
| Check period | xi_timeperiod_24x7 |
Alert Settings
Complete any notification options as required
Click Save
Click Apply Configuration
In the services above, if you have an offloaded database server, change the following:
Common Settings
| Config Name | The name of the offloaded database server (you'll need a host object for this) |
| Manage Hosts button | Select the offloaded database server |
| Active | checked |
| Check command | check_mysql_query |
| $ARG1$ | -H offloaded_server -u readonly -p'readonly_password' |
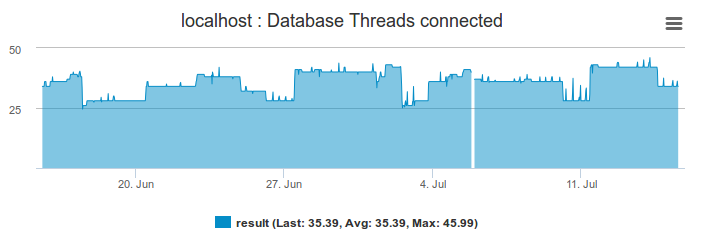
Here are some performance graphs to demonstrate the history collected by these services.


Final Thoughts
For any support related questions please visit the Nagios Support Forums at:
http://support.nagios.com/forum/
Article ID: 513
Created On: Thu, Jun 2, 2016 at 2:30 AM
Last Updated On: Mon, Mar 31, 2025 at 12:55 PM
Authored by: tlea
Online URL: https://support.nagios.com/kb/article/nagios-xi-mysql-mariadb-max-connections-513.html