
Poller Subsystem Overview
The poller subsystem of Nagios Log Server runs on every instance. In addition to updating the elasticsearch database with the current running configuration, the poller subsystem also updates service state information for all of the instances in the Nagios Log Server cluster. In addition to this, the poller subsystem also updates each instance with the current list of all known hosts in the cluster.
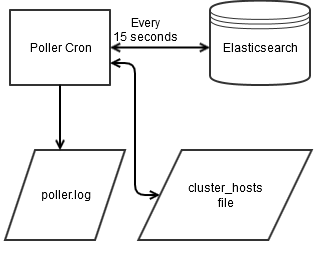
The poller subsystem starts every minute via a cron located at /etc/cron.d/nagioslogserver and runs as the nagios user.
This cron executes a loop that by default runs every 15 seconds to perform the following action:
Update the cluster_hosts file (located at /usr/local/nagioslogserver/var/cluster_hosts ) with the list of all known hosts in the cluster (gathered from an elasticsearch query). The cluster_hosts file is used to determine which hosts the local instance will try to connect to when elasticsearch services are started on the instance.
Sends updates of the following information to elasticsearch for this particular instance:
last_updated time
Log Server Release version
elasticsearch service status
logstash service status
Instance IP address
Instance hostname
The general flow of execution of the poller subsystem works as follows:
The poller.php controller runs as a background process and executes the commands in the process_jobs() method. The poller.php script is located at /var/www/html/nagioslogserver/application/controllers/poller.php and runs under cron every minute. The cron job is defined in /etc/cron.d/nagioslogserver
The poller.php script executes the functions listed in the process_jobs() method of the Poller Controller, and the functions will be located in the poller_helper.php located at /var/www/html/nagioslogserver/application/helpers/poller_helper.php
The poller cron saves output of the run in /usr/local/nagioslogserver/var/poller.log
Some potential problems with the poller subsystem, as well as troubleshooting information are listed below:
Problem: The Instance Status page doesn't list all instances or your service statuses are not updating
Potential Causes:
The poller scripts may not be running. Run the following from the command line to see if the script is running:
ps axuw | grep poller
There may be a problem with the cron job. Check the cron file /etc/cron.d/nagioslogserver to ensure the job is not commented out. Execute the following from the command line to look for possible errors:
tail /var/log/cron
Check the /usr/local/nagioslogserver/var/poller.log log file for errors
The nagios user account could be expired - you can check this with the following from the command line:
chage -l nagios
For any support related questions please visit the Nagios Support Forums at:
http://support.nagios.com/forum/
Article ID: 63
Created On: Fri, Feb 6, 2015 at 2:04 PM
Last Updated On: Tue, May 2, 2017 at 5:14 PM
Authored by: swilkerson
Online URL: https://support.nagios.com/kb/article/nagios-log-server-poller-subsystem-architecture-63.html