
This documentation explains how to install and configure Grafana to generate performance graphs with an existing PNP4Nagios solution. This guide relies on having installed and configured PNP4Nagios using the following documentation:
Nagios Core - Performance Graphs Using PNP4Nagios
If you don't have PNP4Nagios installed and want to use Grafana then you might be interested in this alternate solution:
Nagios Core - Performance Graphs Using InfluxDB + Nagflux + Grafana + Histou
DO NOT follow this guide if you are using Nagios XI. This guide is intended for Nagios Core only.
This guide is broken up into several sections and covers different Linux distributions and operating systems (OS), only the 64-bit (x86_64) implementations of these OS's will work, it does not work on 32-bit (x86). If your Linux Distribution or operating system is not included in this guide then please contact us to see if we can get it added. Some distributions may be missing as we don't have access to a test environment that allows us to develop the documentation.
Note: This guide is based on Nagios Core being installed using the following KB article:
Documentation - Installing Nagios Core From Source
Please select your OS:
This documentation works on CentOS / RHEL / Oracle Linux version 6+. We were unable to get this solution working on versions prior to 6.x.
Please follow the Grafana installation documentation:
http://docs.grafana.org/installation/rpm/
Once installed, execute the following commands to start the service and ensure it is enabled to start on boot:
===== RHEL 6 | CentOS 6 | Oracle Linux 6 =====
chkconfig --add grafana-server
service grafana-server start
===== RHEL 7 | CentOS 7 | Oracle Linux 7 =====
systemctl enable grafana-server.service
systemctl start grafana-server.service
You need to allow port 3000 inbound traffic on the local firewall so you can reach the Grafana web interface:
===== RHEL 6 | CentOS 6 | Oracle Linux 6 =====
iptables -I INPUT -p tcp --destination-port 3000 -j ACCEPT
service iptables save
ip6tables -I INPUT -p tcp --destination-port 3000 -j ACCEPT
service ip6tables save
===== RHEL 7 | CentOS 7 | Oracle Linux 7 =====
firewall-cmd --zone=public --add-port=3000/tcp
firewall-cmd --zone=public --add-port=3000/tcp --permanent
Execute these commands to install the PNP4Nagios components for Grafana:
grafana-cli plugins install sni-pnp-datasource
cd /usr/local/pnp4nagios/share/application/controllers/
wget -O api.php "https://github.com/lingej/pnp-metrics-api/raw/master/application/controller/api.php"
You also need to restart the grafana-server service:
===== RHEL 6 | CentOS 6 | Oracle Linux 6 =====
service grafana-server restart
===== RHEL 7 | CentOS 7 | Oracle Linux 7 =====
systemctl restart grafana-server.service
Grafana will be making calls to the PNP API and will require permission. This guide focusses on granting access to the local host however with "CentOS | RHEL | Oracle Linux 6.x" a username/password is required.
===== RHEL 6 | CentOS 6 | Oracle Linux 6 =====
The following command will add the user grafana with the password ANAFARG to htpasswd.users:
htpasswd -b /usr/local/nagios/etc/htpasswd.users grafana ANAFARG
Please proceed to the Grafana Configuration section for the next step.
===== RHEL 7 | CentOS 7 | Oracle Linux 7 =====
The method used here is to allow the 127.0.0.1 & ::1 addresses of the Nagios server access. This is defined by adding the following line to pnp4nagios.cfg:
Require ip 127.0.0.1 ::1
The following command will add that line to pnp4nagios.cfg:
sed -i '/Require valid-user/a\ Require ip 127.0.0.1 ::1' /etc/httpd/conf.d/pnp4nagios.conf
The Apache httpd service needs to be restarted for this change to take affect:
systemctl restart httpd.service
Please proceed to the Grafana Configuration section for the next step.
This documentation works on Ubuntu version 16+. We were unable to get this solution working on versions prior to 16.x.
Please follow the Grafana installation documentation:
http://docs.grafana.org/installation/debian/
Once installed, execute the following commands to start the service and ensure it is enabled to start on boot:
sudo systemctl enable grafana-server.service
sudo systemctl start grafana-server.service
You need to allow port 3000 inbound traffic on the local firewall so you can reach the Grafana web interface.
sudo ufw allow 3000/tcp
sudo ufw reload
Execute these commands to install the PNP4 components for Grafana:
sudo grafana-cli plugins install sni-pnp-datasource
sudo systemctl restart grafana-server.service
cd /usr/local/pnp4nagios/share/application/controllers/
sudo wget -O api.php "https://github.com/lingej/pnp-metrics-api/raw/master/application/controller/api.php"
Grafana will be making calls to the PNP API and will require permission. The method used here is to allow the 127.0.0.1 & ::1 addresses of the Nagios server access. This is defined by adding the following line to pnp4nagios.cfg:
Require ip 127.0.0.1 ::1
The following command will add that line to pnp4nagios.cfg:
sudo sh -c "sed -i '/Require valid-user/a\ Require ip 127.0.0.1 ::1' /etc/apache2/sites-enabled/pnp4nagios.conf"
The Apache apache2 service needs to be restarted for this change to take affect:
sudo systemctl restart apache2.service
Please proceed to the Grafana Configuration section for the next step.
This documentation was tested on SUSE SLES 12.2+ and openSUSE Leap 42.2+.
Please follow the Grafana installation documentation:
http://docs.grafana.org/installation/rpm/
Once installed, execute the following commands to start the service and ensure it is enabled to start on boot:
sudo systemctl enable grafana-server.service
sudo systemctl start grafana-server.service
You need to allow port 3000 inbound traffic on the local firewall so you can reach the Grafana web interface:
===== SUSE SLES 12.x =====
sudo /usr/sbin/SuSEfirewall2 open EXT TCP 3000
sudo systemctl restart SuSEfirewall2
===== openSUSE Leap 42.x =====
The firewall service is not enabled by defauly on openSUSE.
Execute these commands to install the PNP4 components for Grafana:
sudo grafana-cli plugins install sni-pnp-datasource
sudo systemctl restart grafana-server.service
cd /usr/local/pnp4nagios/share/application/controllers/
sudo wget -O api.php "https://github.com/lingej/pnp-metrics-api/raw/master/application/controller/api.php"
Grafana will be making calls to the PNP API and will require permission. The method used here is to allow the 127.0.0.1 & ::1 addresses of the Nagios server access. This is defined by adding the following line to pnp4nagios.cfg:
Require ip 127.0.0.1 ::1
The following command will add that line to pnp4nagios.cfg:
sudo sh -c "sed -i '/Require valid-user/a\ Require ip 127.0.0.1 ::1' /etc/apache2/vhosts.d/pnp4nagios.conf"
The Apache apache2 service needs to be restarted for this change to take affect:
sudo systemctl restart apache2.service
Please proceed to the Grafana Configuration section for the next step.
This documentation works on Debian / Raspbian version 8+. We were unable to get this solution working on versions prior to 8.x.
All steps on Debian require to run as root. To become root simply run:
Debian:
su
Raspbian:
sudo -i
All commands from this point onwards will be as root.
Please follow the Grafana installation documentation:
http://docs.grafana.org/installation/debian/
Once installed, execute the following commands to start the service and ensure it is enabled to start on boot:
systemctl enable grafana-server.service
systemctl start grafana-server.service
You need to allow port 3000 inbound traffic on the local firewall so you can reach the Grafana web interface.
iptables -I INPUT -p tcp --destination-port 3000 -j ACCEPT
Execute these commands to install the PNP4 components for Grafana:
grafana-cli plugins install sni-pnp-datasource
systemctl restart grafana-server.service
cd /usr/local/pnp4nagios/share/application/controllers/
wget -O api.php "https://github.com/lingej/pnp-metrics-api/raw/master/application/controller/api.php"
Grafana will be making calls to the PNP API and will require permission. The method used here is to allow the 127.0.0.1 & ::1 addresses of the Nagios server access. This is defined by adding the following line to pnp4nagios.cfg:
Require ip 127.0.0.1 ::1
The following command will add that line to pnp4nagios.cfg:
sed -i '/Require valid-user/a\ Require ip 127.0.0.1 ::1' /etc/apache2/sites-enabled/pnp4nagios.conf
The Apache apache2 service needs to be restarted for this change to take affect:
systemctl restart apache2.service
Please proceed to the Grafana Configuration section for the next step.
Please follow the Grafana installation documentation:
http://docs.grafana.org/installation/rpm/
Once installed, execute the following commands to start the service and ensure it is enabled to start on boot:
systemctl enable grafana-server.service
systemctl start grafana-server.service
You need to allow port 3000 inbound traffic on the local firewall so you can reach the Grafana web interface:
firewall-cmd --zone=FedoraServer --add-port=3000/tcp
firewall-cmd --zone=FedoraServer --add-port=3000/tcp --permanent
Execute these commands to install the PNP4 components for Grafana:
grafana-cli plugins install sni-pnp-datasource
systemctl restart grafana-server.service
cd /usr/local/pnp4nagios/share/application/controllers/
wget -O api.php "https://github.com/lingej/pnp-metrics-api/raw/master/application/controller/api.php"
Grafana will be making calls to the PNP API and will require permission. The method used here is to allow the 127.0.0.1 & ::1 addresses of the Nagios server access. This is defined by adding the following line to pnp4nagios.cfg:
Require ip 127.0.0.1 ::1
The following command will add that line to pnp4nagios.cfg:
sed -i '/Require valid-user/a\ Require ip 127.0.0.1 ::1' /etc/httpd/conf.d/pnp4nagios.conf
The Apache httpd service needs to be restarted for this change to take affect:
systemctl restart httpd.service
Please proceed to the Grafana Configuration section for the next step.
Please follow these instructions to install Grafana:
pacman --noconfirm -Syyu
pacman --noconfirm -S grafana
Once installed, execute the following commands to start the service and ensure it is enabled to start on boot:
systemctl enable grafana.service
systemctl start grafana.service
Arch Linux does not have a firewall enabled in a fresh installation. Please refer to the Arch Linux documentation on allowing TCP port 3000 inbound.
Execute these commands to install the PNP4 components for Grafana:
grafana-cli plugins install sni-pnp-datasource
systemctl restart grafana.service
cd /usr/local/pnp4nagios/share/application/controllers/
wget -O api.php "https://github.com/lingej/pnp-metrics-api/raw/master/application/controller/api.php"
Grafana will be making calls to the PNP API and will require permission. The method used here is to allow the 127.0.0.1 & ::1 addresses of the Nagios server access. This is defined by adding the following line to pnp4nagios.cfg:
Require ip 127.0.0.1 ::1
The following command will add that line to pnp4nagios.cfg:
sed -i '/Require valid-user/a\ Require ip 127.0.0.1 ::1' /etc/httpd/conf/extra/pnp4nagios.conf
The Apache httpd service needs to be restarted for this change to take affect:
systemctl restart httpd.service
Please proceed to the Grafana Configuration section for the next step.
Please follow these instructions to install Grafana:
emerge --sync
echo ">=www-apps/grafana-bin-5.0.0 **" >> /etc/portage/package.accept_keywords
emerge --noreplace www-apps/grafana-bin
Once installed, execute the following commands to start the service and ensure it is enabled to start on boot:
rc-update add grafana default
rc-service grafana start
Gentoo does not have a firewall enabled in a fresh installation. Please refer to the Gentoo documentation on allowing TCP port 3000 inbound.
Execute these commands to install the PNP4 components for Grafana:
grafana-cli plugins install sni-pnp-datasource
ln -s /var/lib/grafana/plugins/sni-pnp-datasource /usr/share/grafana/data/plugins
rc-service grafana restart
cd /usr/local/pnp4nagios/share/application/controllers/
wget -O api.php "https://github.com/lingej/pnp-metrics-api/raw/master/application/controller/api.php"
Grafana will be making calls to the PNP API and will require permission. The method used here is to allow the 127.0.0.1 & ::1 addresses of the Nagios server access. This is defined by adding the following line to pnp4nagios.cfg:
Require ip 127.0.0.1 ::1
The following command will add that line to pnp4nagios.cfg:
sed -i '/Require valid-user/a\ Require ip 127.0.0.1 ::1' /etc/apache2/vhosts.d/pnp4nagios.conf
The Apache apache2 service needs to be restarted for this change to take affect:
rc-service apache2 restart
Please proceed to the Grafana Configuration section for the next step.
Please follow these instructions to install Grafana:
pkg install -y grafana4
Once installed, execute the following commands to start the service and ensure it is enabled to start on boot:
echo 'grafana_enable="YES"' >> /etc/rc.conf
service grafana onestart
FreeBSD does not have a firewall enabled in a fresh installation. Please refer to the FreeBSD documentation on allowing TCP port 3000 inbound.
Execute these commands to install the PNP4 components for Grafana:
grafana-cli plugins install sni-pnp-datasource
service grafana onerestart
cd /usr/local/pnp4nagios/share/application/controllers/
wget -O api.php "https://github.com/lingej/pnp-metrics-api/raw/master/application/controller/api.php"
Grafana will be making calls to the PNP API and will require permission. The method used here is to allow the 127.0.0.1 & ::1 addresses of the Nagios server access. This is defined by adding the following line to pnp4nagios.cfg:
Require ip 127.0.0.1 ::1
The following command will add that line to pnp4nagios.cfg:
perl -ni.bak -le 'print; print " Require ip 127.0.0.1 ::1" if /Require valid-user/' /usr/local/etc/apache24/Includes/pnp4nagios.conf
The Apache apache2 service needs to be restarted for this change to take affect:
service apache24 onerestart
Please proceed to the Grafana Configuration section for the next step.
Grafana needs to be configured to use the PNP4Nagios API. Open your web browser to the following URL:
http://nagios_server:3000
Replace nagios_server with the DNS record or ip address of your Nagios Core server.
You will be prompted with a login page, the default username is admin and the password is admin.
You will be presented with the Home Dashboard and you'll see an Add data source icon, click it to continue.
On the next screen click the PNP button:

You will need to populate the following information:

Once populated click the Save & Test button. When the screen refreshes, if all settings are correct you will be notified that the Data source is working.
The next step is to create a dashboard & graph.
Now that Grafana has been configured you need to create a dashboard and then add a graph to the dashboard.
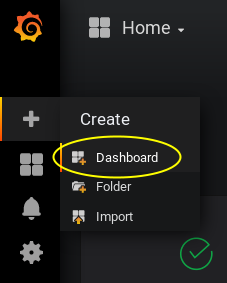
On the left navigation men hover over the + icon and select Create > Dashboard.
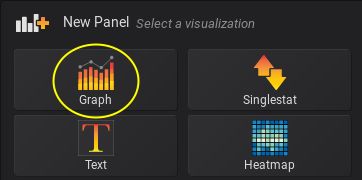
This creates an empty dashboard that needs panels added to it, this example will add a Graph panel.
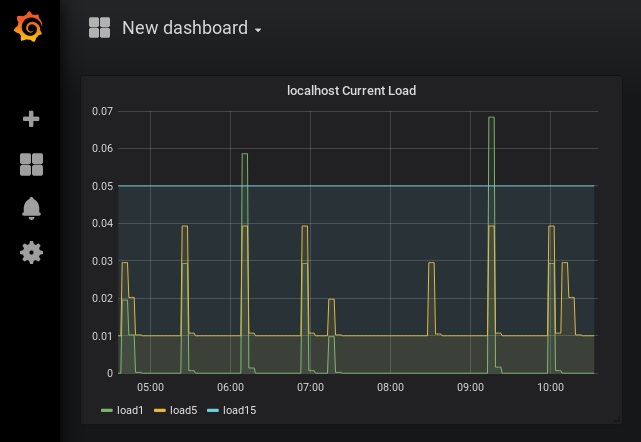
An empty graph is added to the dashboard, to add data points to the graph click the Panel Title and select Edit.

This opens the editor interface for the panel. At the bottom you can see a list of tabs and the Metrics tab is selected by default. On this tab you will be able to add metric(s) to the graph using queries. This example is going to show you how create a graph for the localhost object that has the Current Load service. This is being used because the Current Load service has three separate data sources that need to be added to the graph.

After making those choices click the Back to dashboard button at the top right of the screen. You will exit the edit mode and the graph will now appear with the metrics you just added.
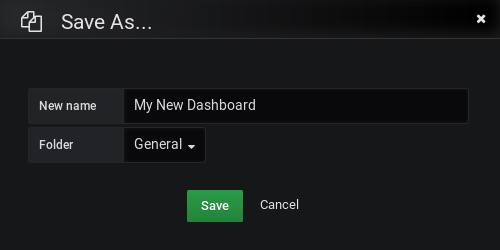
Click the Save icon in the top right corner of the screen and provide a name when prompted.
This completes the steps required for using Grafana With PNP4Nagios on Nagios Core.
To get the most out of Grafana and PNP4Nagios you should check out the documentation:
http://docs.grafana.org/guides/getting_started/
https://github.com/sni/grafana-pnp-datasource
Final Thoughts
For any support related questions please visit the Nagios Support Forums at:
http://support.nagios.com/forum/
Article ID: 803
Created On: Wed, Mar 7, 2018 at 5:40 PM
Last Updated On: Wed, May 22, 2019 at 7:38 PM
Authored by: tlea
Online URL: https://support.nagios.com/kb/article/nagios-core-using-grafana-with-pnp4nagios-803.html