Navigate to Dashboard on the main menu.
To open a blank dashboard, go to Load > Empty Dashboard.

Add rows for the dashboard by clicking + Add a Row.
Create two rows called Fields and Panels.

Save.
Click Add Panel to Empty Row button on lower Row.
On the resulting Row Settings popup, select Table in the Select Panel Type dropdown.
Change the Span drowdown to 12 and Save.
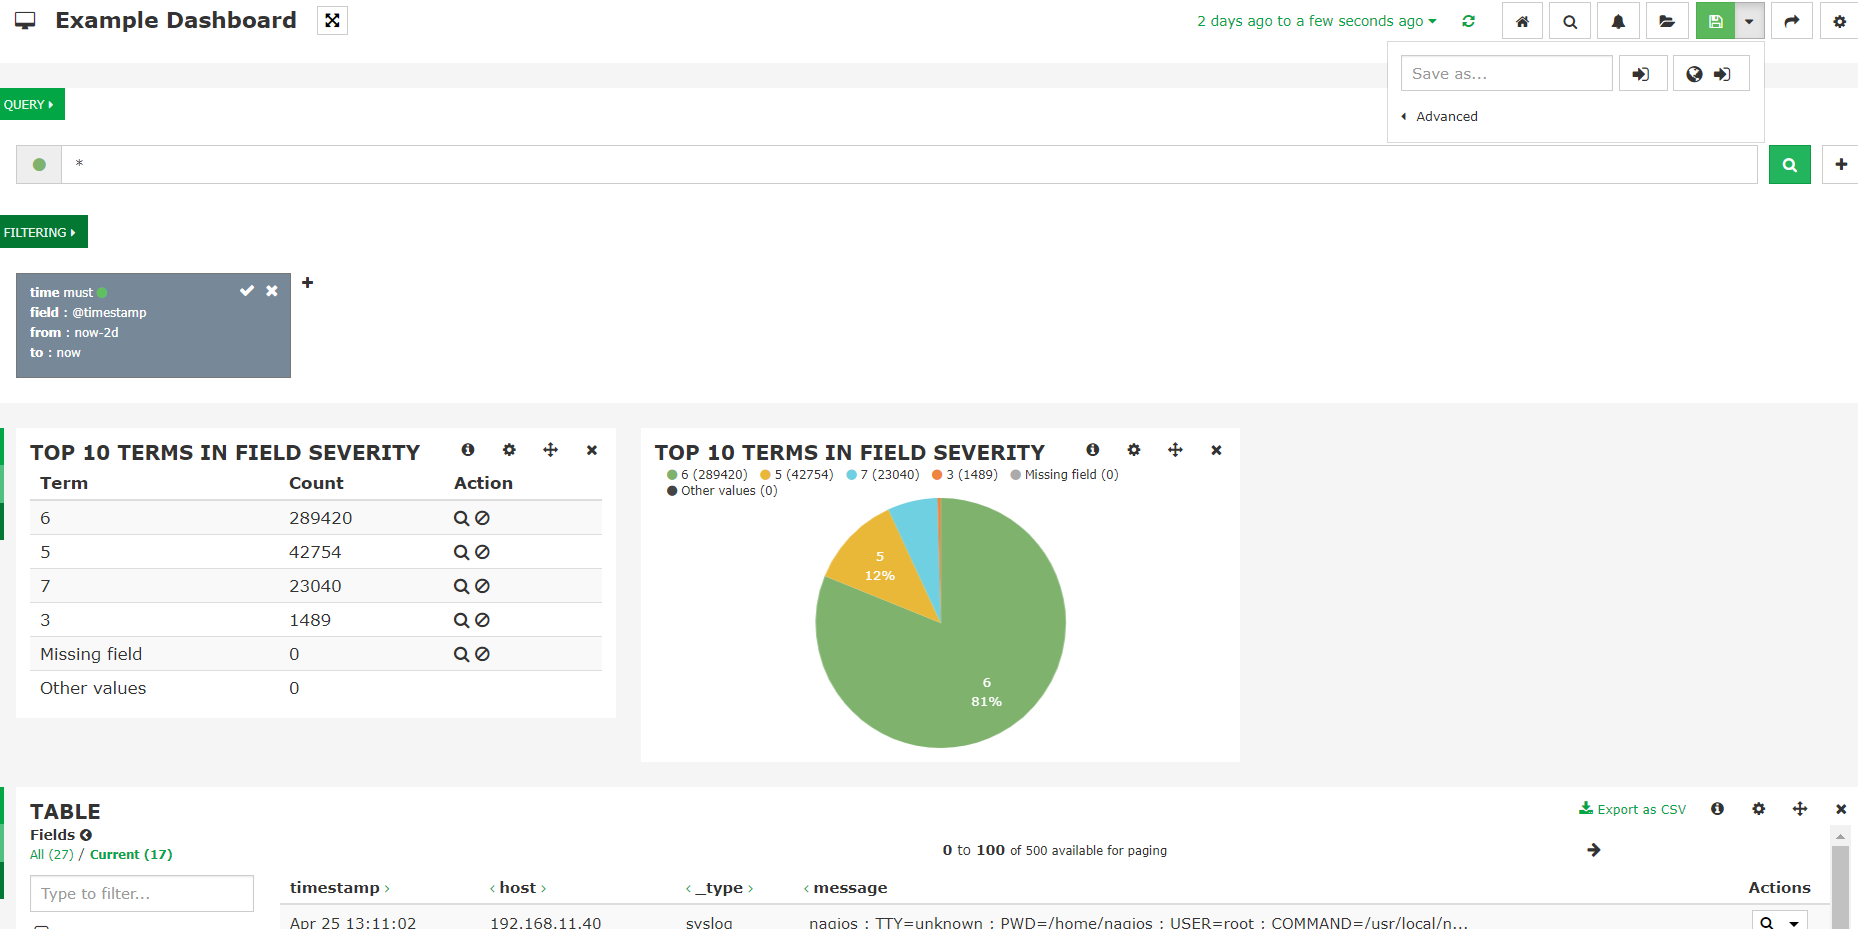
Set the Time Filter on the main dashboard page to the desired time frame. Data will now display in the Fields table.
Select table fields that you would like to see in the table. Some examples would be timestamp, host, type, and message.
To add a visual from the data to the Panel row, select one of the field name links. In the Micro-Analysis popup, select the term type you would like to see (Bar, Pie, Table). This example is using Severity and a Pie chart.

The visual will be added to the top of the Fields row. Move the visual to the Panel row by dragging and dropping.
You can configure the visual as desired by clicking on the configure icon in the top right of the visual. (Change the span, for example, to add more than one visual to the row)
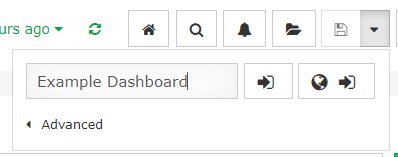
Save the dashboard by clicking on the save icon in the top right and naming the dashboard in the Save As field.