
High-Level Overview
Nagios Log Server is an application that provides organizations a central location to send their machine generated event data (e.g., Windows Event Logs, Linux syslogs, mail server logs, web server logs, application logs) which will index the content of the messages, and store the data for later retrieval, querying, and analysis in near real-time.
Once log data has been indexed (indexing usually happens within 5 seconds from arrival) it can be easily analyzed using the graphical query and filtering tools on the dashboard. Alerts can be created based on a query, and are able to be sent via email to users of your choice. Alerts can also be sent to Nagios XI/Nagios Core via NRDP, send a SNMP Trap, or even start a custom script.
The data that is sent to Nagios Log Server can be automatically archived to a shared network drive. The archived data can be restored and re-analyzed at any point in the future.
What that means in plain English is that it can be used to record any log events that are happening across all of the machines and network devices organization-wide. Users of Log Server can access all of this data in a central location, searching it through the UI. Having all of the data in one location has the benefit of being able to compare or correlate log data from multiple devices. Also, the automated archiving of the log data will assist in maintaining compliance with certain standards which require log data to be stored for various amounts of time.
Most Common Use Case
An obvious application where Log Server could be used would be as an advanced system to analyze the received logged events and send important items (e.g. Critical Errors or security related items) to Nagios Core or Nagios XI
Less Common Use Cases
Developers can send debug logs to Log Server, and easily filter out the information that isn't important leaving just the key items of interest
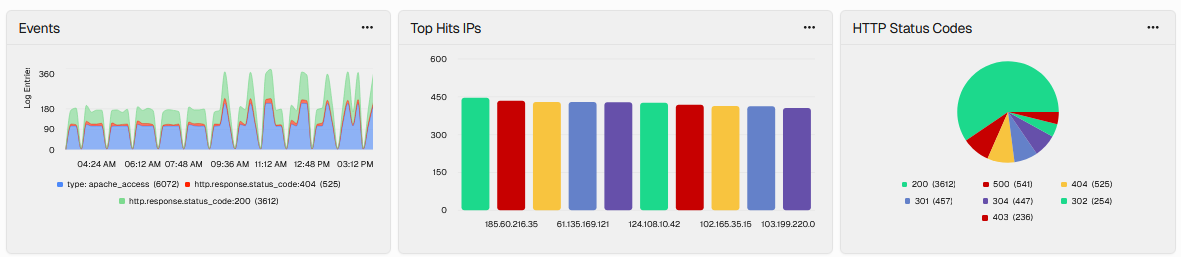
Organizations can utilize the graphical and analytic capabilities of Log Server to analyze web server logs, not only for errors, but to determine what are the most requested pages, the geo-location of their visitors, popular browsers and more
With a small script, users could archive Nagios XI or Core check results including performance data, and have the ability to set up custom dashboards visualizing the data however they wish (table, bar graph, pie chart, etc..)
Log Server could be used to index and archive messages from an IMAP mailbox, for security or historical reference
Log Server can also receive SNMP traps, again allowing all of the previous functionality on the traps received
The Benefits of Nagios Log Server Over Text-Based Systems
Nagios Log Server allows all of your organization's machine generated data to be stored and indexed in one central location, allowing for queries to be performed on all of the log data at the same time providing the ability for correlative analysis. Additionally, this data can be presented to the user running the query in customized views called dashboards, including a table of results, bar charts, pie charts, line graphs, etc. for any of the fields of data. Additionally, fields in the logs that are determined to be numeric can have calculations done when creating/using the graphing/table functionality to provide data like total, min, max, mean, etc.

Important Terms and Vocabulary
Nagios Log Server is a combination of two main open-source components: Opensearch and Logstash. The Nagios Log Server web frontend, custom-coded by the Nagios development team, is a powerful user interface that makes leveraging the power of these tools and managing them accessible.
Opensearch: The scalable and redundant datastore used by Log Server.
Logstash: The log receiver for Log Server – Logstash outputs logs to the Opensearch database.
More detailed information can be found in the following documentation:
Documentation - Technical Overview and Terminology Definitions
How Nagios Log Server differs from regular Opensearch and Logstash
Nagios Log Server (NLS) comes pre-configured for optimal performance, so system administrators can spend more time producing log visualizations, and less time tuning their machines
NLS is fully supported by Nagios support staff - by phone, email, or forum
NLS comes with authentication and security built-in. Typically, the open source stack is open to whoever wants to query it – meaning that system administrators need to spend time developing protection methods. Nagios Log Server comes with built-in security and authentication
NLS has an alert system built in - you are capable of alerting based on log queries via email. It can also tie in with several other Nagios products including Nagios XI
Understanding Opensearch
Opensearch is a transparent component – it does not need a lot of tuning, especially if your cluster is small.
Opensearch is the database of choice because it is distributed and redundant by default. Every time an instance is added to your cluster, Opensearch ensures that its database is spread across all nodes appropriately by moving around the various shards in a manner that increases the resiliency of the data.

In the above picture, there are two instances joined in a single cluster. Each instance contains two primary shards (colored blue) and two replica shards (colored red). Note that Opensearch will never assign a matching primary shard and replica shard to the same instance, which is how high availability is achieved.
Understanding Logstash
Logstash is the most complex component in Nagios Log Server that an administrator will have to deal with. It is imperative that a good understanding of logstash is developed. The logstash agent is a processing pipeline with 3 stages: inputs -> filters -> outputs. Inputs receive incoming logs, and pass those logs to the filter chain, filters modify them, outputs ship them elsewhere - in our case, to the opensearch database.
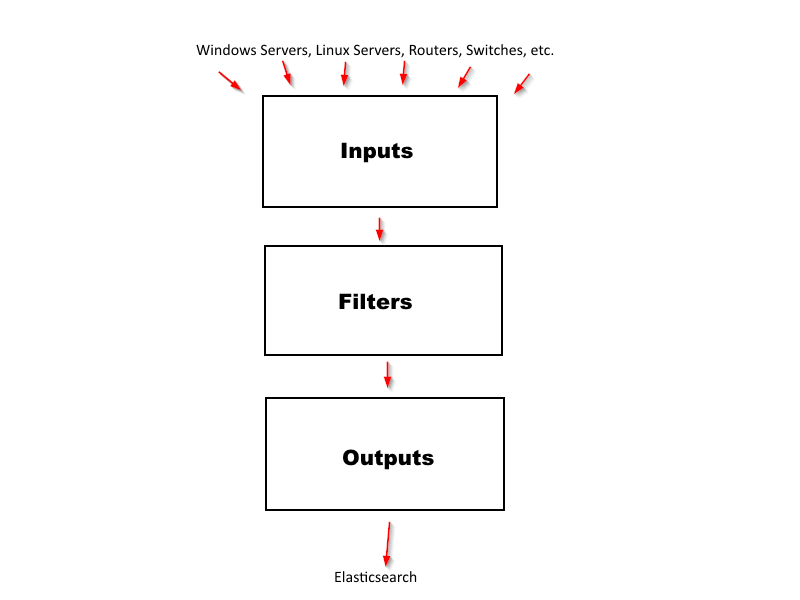
Inputs
Inputs listen for incoming logs. The three most common inputs by far are TCP, UDP, and syslog. The tcp input will listen on a specified TCP port, and accept any logs coming in on that port. The UDP input will do the same, but it will listen on a UDP port. The syslog input is where things get a little more complex - every log that comes into the syslog input will automatically have the 'syslog' filter applied. For reference, the syslog filter is a simple grok filter that looks like this:
"match" => { "message" => "<%{POSINT:priority}>%{SYSLOGLINE}"
More detailed information on inputs can be found in the following documentation:
Documentation - Configuring Inputs
Filters
Filters are the most complex and important part of the Logstash chain. If you spend time learning anything, learn filters. It will help if you have a background in regular expression. Regular expression syntax doesn't take very long to learn, and it is tremendously helpful when generating your own filters. There are many free tutorials online to learn from.
Logstash filters parse logs passed down from the input chain to 'filters' that you define. Before filters are applied, your logs are likely unstructured and have no 'fields' applied to them. After filtering, you might see fields like the following.
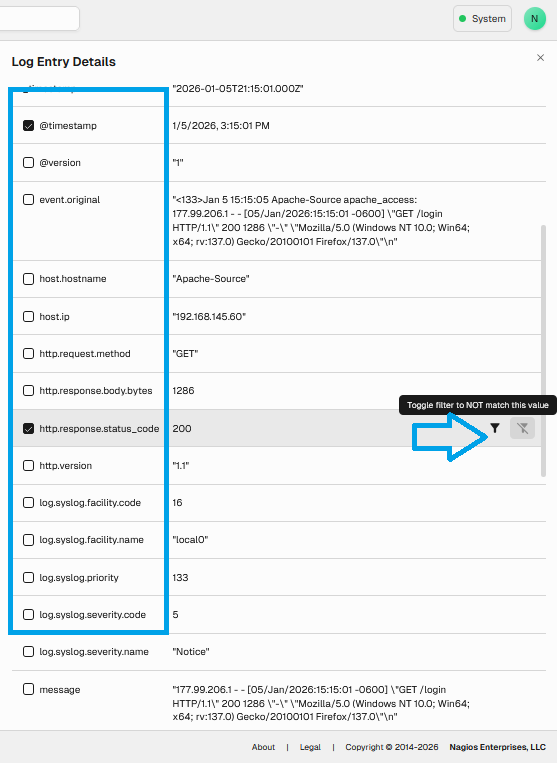
Fields are important because they enable the creation of graphs, visualizations, queries, and alerts for specific occurrences.
More detailed information on filters can be found in the following documentation:
Documentation - Configuring Filters
Outputs
Outputs allow you to send the log data externally, this is a more complicated topic and is not required for Nagios Log Server functionality. The following documentation demonstrates how an output can be created:
Documentation - Using An Output To Create Nagios XI Passive Objects
For any support related questions please visit the Nagios Support Forums at:
http://support.nagios.com/forum/
Article ID: 98
Created On: Thu, Jun 4, 2015 at 4:01 PM
Last Updated On: Mon, Jan 5, 2026 at 3:39 PM
Authored by: jolson
Online URL: https://support.nagios.com/kb/article/nagios-log-server-full-architecture-overview-98.html