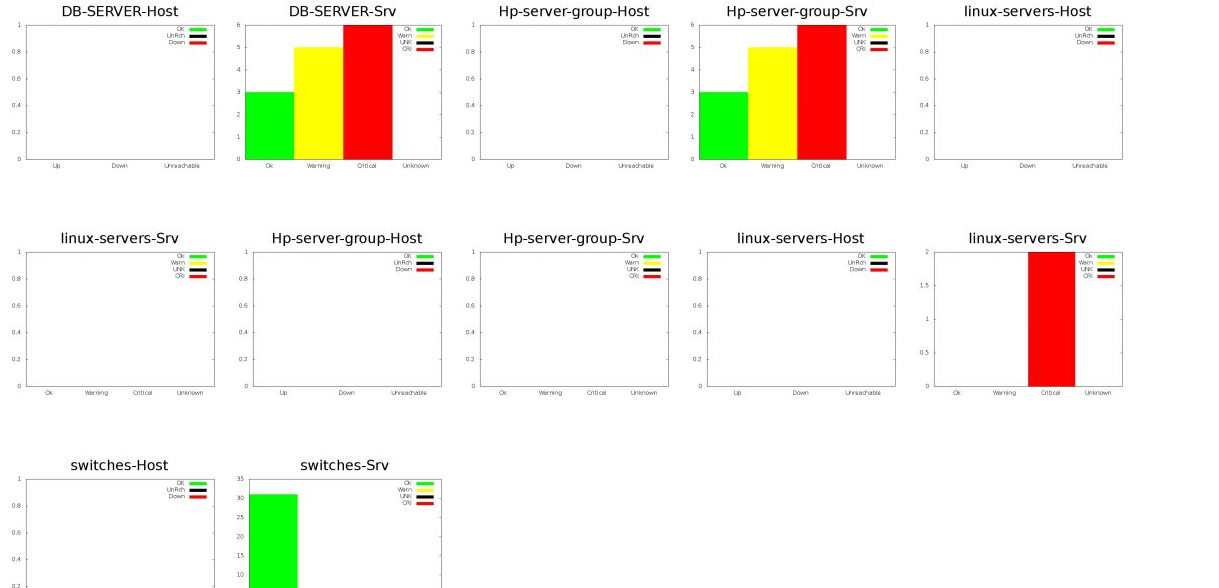
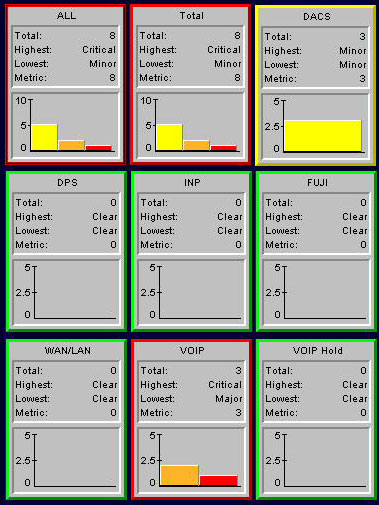
is there a way to display nagios alerts in pi charts based on groups as shown below
please guide me
thanks
Moderator Note: I have moved your thread to the Nagios Core section
Code: Select all
http://<nagios ip>/nagios/jsonquery.htmlCode: Select all
#! /usr/bin/env python
import urllib2
import sys
import csv
from bs4 import BeautifulSoup
SERVER = sys.argv[1]
authinfo = urllib2.HTTPPasswordMgrWithDefaultRealm()
authinfo.add_password(None, SERVER, 'nagiosadmin', 'xxxxx')
page = sys.argv[1]
handler = urllib2.HTTPBasicAuthHandler(authinfo)
myopener = urllib2.build_opener(handler)
opened = urllib2.install_opener(myopener)
output = urllib2.urlopen(page)
soup = BeautifulSoup(output)


table = soup.find("table", { "class" : sys.argv[2] })
headers = [header.text for header in table.find_all('th')]
rows = []
for row in table.find_all('tr'):
      rows.append([val.text.encode('utf8') for val in row.find_all('td')])

with open('data.dat', 'wb') as f:
     writer = csv.writer(f)
     writer.writerow(headers)
     writer.writerows(row for row in rows if row)


with open('data.dat') as f:
    reader = csv.reader(f)
    cols = []
    for row in reader:
        cols.append(row)

with open('data.csv', 'wb') as f:
    writer = csv.writer(f)
    for i in range(len(max(cols, key=len))):
writer.writerow([(c[i] if i<len(c) else '') for c in cols])Code: Select all
#!/usr/bin/gnuplot
reset
set terminal png
set yrange [0:]
set style fill solid
set boxwidth 1 absolute
set xtic scale 0
set datafile separator ","
set term png
set output hist
upROW(x,y)=(x eq "Up") ? y:1/0
UnrROW(x,y) =(x eq "Unreachable") ? y:1/0
dwnROW(x,y) =(x eq "Down") ? y:1/0
PenROW(x,y) =(x eq "Pending") ? y:1/0
plot data u ($0):(PenROW(stringcolumn(1),$2)):xtic(1) w boxes lc rgb "gray" ti "pen" , '' u ($0):(UnrROW(stringcolumn(1),$2)):xtic(1) w boxes lc rgb "black" ti "UnRch" , '' u ($0):(dwnROW(stringcolumn(1),$2)):xtic(1) w boxes lc rgb "red" ti "Down"