Page 1 of 2
check_procs wrong response
Posted: Fri Jun 27, 2014 11:33 am
by vvz
Hi!
I use check_procs plugin to check processes running on remote hosts via NRPE.
Everything is OK, but only for the one of remote hosts I get wrong response on web-interface.
It constantly shows from 15 till 30 Zombies on host. When I check with top locally, there are no Zombies or maximum 1.
I tried to run the plugin locally and compared with top output. They both give identical response.
That means it is not the plugin problem.
Any ideas what should I check ?
Thank you
Re: check_procs wrong response
Posted: Fri Jun 27, 2014 11:42 am
by tmcdonald
What do you have defined as the NRPE command for this plugin on the machine that is misbehaving?
Re: check_procs wrong response
Posted: Fri Jun 27, 2014 11:46 am
by vvz
nrpe.cfg
command[check_zombie_procs]=/usr/lib64/nagios/plugins/check_procs -w 20 -c 30 -s Z
Re: check_procs wrong response
Posted: Fri Jun 27, 2014 11:52 am
by tmcdonald
Can you post both the output from running the command manually on the remote host and the result of the NRPE from the XI interface?
In addition, in the XI interface for that service can you click the service name and under the Advanced tab post a screenshot so I can see the perfdata?
Re: check_procs wrong response
Posted: Fri Jun 27, 2014 11:54 am
by vvz
Sorry, but I'm using Nagios Core
Re: check_procs wrong response
Posted: Fri Jun 27, 2014 12:04 pm
by vvz
for now I have again Zombies = 0 on web interface.
As soon as I get this issue again, I will send you output of web -interface, plugin's output and top output
Re: check_procs wrong response
Posted: Fri Jun 27, 2014 12:04 pm
by tmcdonald
My mistake. Same process though. This is the info I need:
- 2014-06-27 12_03_57-Nagios Core.png (8.5 KiB) Viewed 4074 times
Re: check_procs wrong response
Posted: Fri Jun 27, 2014 12:11 pm
by vvz
it is on web-interface :
Zombies processes
Notifications for this service have been disabled
WARNING 06-27-2014 13:03:46 0d 0h 5m 5s 2/5 PROCS WARNING: 26 processes with STATE = Z
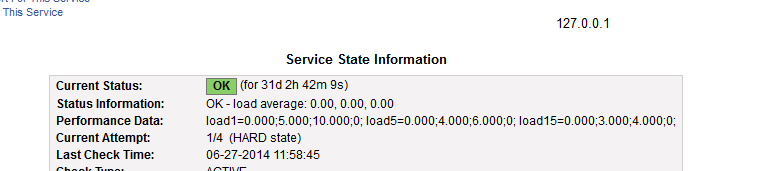
[img]
Service State Information
Current Status: OK (for 0d 0h 0m 20s)
Status Information: PROCS OK: 10 processes with STATE = Z
Performance Data:
Current Attempt: 1/5 (HARD state)
Last Check Time: 06-27-2014 13:06:46
Check Type: ACTIVE
Check Latency / Duration: 0.229 / 0.076 seconds
Next Scheduled Check: 06-27-2014 13:09:46
Last State Change: 06-27-2014 13:06:46
Last Notification: N/A (notification 0)
Is This Service Flapping? NO (0.00% state change)
In Scheduled Downtime? NO
Last Update: 06-27-2014 13:06:59 ( 0d 0h 0m 7s ago)
Active Checks:
ENABLED
Passive Checks:
ENABLED
Obsessing:
ENABLED
Notifications:
DISABLED
Event Handler:
DISABLED
Flap Detection:
ENABLED
[/img]
this is a CLI command I run locally:
./check_procs -w 20 -c 30 -s Z
the output:
PROCS OK: 0 processes with STATE = Z
Zombies numbers are different on web-interface and taken from service windows because this number is changing constantly. From 0 till 30.
Do you need real image of window?
Re: check_procs wrong response
Posted: Fri Jun 27, 2014 12:28 pm
by vvz
I've just remarked that PERFORMANCE DATA line is empty for all services for all hosts.
Something is wrong with that?
Re: check_procs wrong response
Posted: Fri Jun 27, 2014 12:32 pm
by vvz
Performance Data: rta=0.044000ms;300.000000;500.000000;0.000000 pl=0%;80;100;0
that is for the host the service is running on