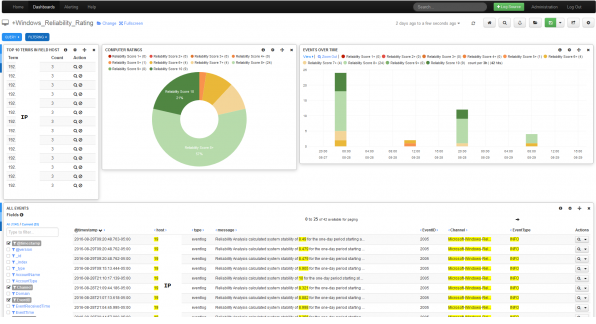
Dashboard Overview
Dashboards represent visualization of data within Nagios Log Server. Dashboards typically have a query and filters assigned to them which ultimately determine the data set being analyzed. See Configuring Filters for more information.

Creating a Log Server Dashboard
Global vs My Dashboards
From the Home page on the right, you’ll find a short listing of Global and My Dashboards. The difference is that Users with limited access can only see their own dashboards, while Admin users have the ability to view and edit other users dashboards.

Importing Dashboards
It’s also possible to download dashboards from the Nagios Exchange and import them into Log Server.
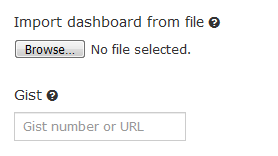
From the Dashboards page choose Load > Advanced > Import Dashboard from File.

Rows and Panels
Dashboards are made of rows and panels. The panels are populated with graphs, tables and other visualizations.
Near the bottom of any given dashboard, you should see a ![]() button. This allows you to add a row to the dashboard that acts as a container for your panels.
button. This allows you to add a row to the dashboard that acts as a container for your panels.
Once the row has been created, you can click the ![]() button to add your first panel. Subsequent panels can be added by using the blue menu on the left-hand side of the panel. This blue menu also allows you to modify the row itself or collapse it from view.
button to add your first panel. Subsequent panels can be added by using the blue menu on the left-hand side of the panel. This blue menu also allows you to modify the row itself or collapse it from view.
There are a few different types of panels that examine different things. The most commonly used panel is the "terms" panel which displays information about what a certain field’s value is or is not. Other panels can contain more specific fields from your data set, examine averages over a period of time, display aggregate results based on location (useful when geotagging IP addresses to spot traffic), and all sorts of applications in-between.
Dashboard Building Blocks
There are several building blocks for creating new dashboards: time periods, queries, filters and visualizations.
|
Time Periods |
Queries |
Filters |
Visualizations |
|
Chosen from the drop down list in the upper right. The defalt time period is the last 24 hours. |
Limit the dashboard data by performing searches on data by categories, messages, log types...etc. You can define multiple queries and set the color. |
Similar to queries, filters are used to limit the data in the dashboard. You can assign multiple filters. |
As explained above, graphs, tables and other visualizations are assigned to panels within rows. |


