;)

;)
;)

;)
;)
;)

;)
;)
;)
;)
;)
;)
;)
;)
;)

;)
;)
;)
;)
;)
;)
;)
;)
;)
;)
;)
;)
;)
;)
;)
;)
;)
;)
;)

Overview
We will be using Nagios Network Analyzer to manipulate the flow data to get any information that we would like. One thing to note, is that this manipulation will not destroy your data at all, so feel free to experiment, as there is no chance at all that you will break anything. In fact, experimenting is the best way to learn!
A Word of Vernacular
In the following document I will be using dstip, srcip, dstport and srcport a lot. While it might seem obvious, they stand for destination IP, source IP, destination port and source port, respectively. Destination IP tells which IP the traffic was headed to, while Source IP tells which IP the traffic originated from. Similarly, Source Port tells which port the traffic was transmitted on and Destination port tells which port received the data.
On a similar note, the dst and src, meaning destination and source, will be used as well.
Starting a Query
For now, let's assume that you already have some flow data. Select a source and then select the “Queries” sub-tab listed under the source name. Below is a screenshot of something close to what you should see once you're there. This is where we will be doing the majority of work and explanation in this document, and will most likely be the entry point for any deep-diving you do into the data.

On this page, you'll see many fields. This section will give a description what each one is for, and how to use it.
Aggregate By
This is how the flows will be associated with each other. This field should be a comma delimited list of aggregate values such as dstip, srcip, dstport and srcport. When the flows get aggregated, it groups all like values for that aggregate value together. For instance, if we simply specify dstip for our value, all unique values of dstip will be grouped together.
Try it out: Leave the query field blank and try running the query. This is an example of what you might get:
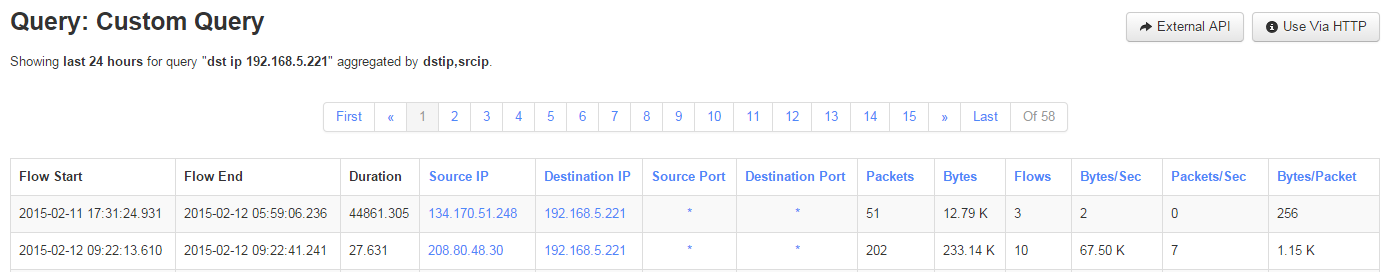
Notice that all the IPs listed are unique. This is because as our query looked through the flow data, it grouped all of the dstip that were the same data, and treated them as one entity, and simply computed a running sum for all unique destination IP's metrics.
We can increase the granularity here by adding srcip to the 'Aggregate By' string. Change the 'Aggregate By' string to dstip,srcip . This will now treat dstip and srcip as unique entries. Two connections from IP A to IP B will be summed and represented as one, however IP B to IP A will be not be in that same category.
You can continue adding aggregate values to the string if you wish, and I suggest you play around with it until you get the hang of it. A few things to note: the more aggregate values you have, the more unique values show up, so the queries will generally take longer to run the more aggregate values you have. Also, you are not limited to only aggregating by similar values, in other words you do not have to use srcip,dstip , you can mix and match.
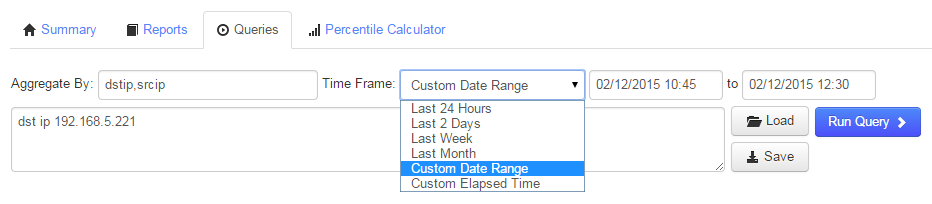
Time Frame
This is where you set the time frame to query the data. This section is largely self-explanatory, but you can set either hard date times to search between, or you can set soft date times. Hard date times would be exact times, like from 1:00PM on January 1 st until 2:00PM on January 1 st . You can also set elapsed time frames, to specify something like 3 hours ago until now.
Raw Query
This is the field that will almost certainly be your most powerful tool when sorting through data. In this field you will enter a query string to sort through the data, and if you have ever used tcpdump before, this section will be familiar. In this query string you can specify quite a few parameters to limit what is shown to you and chain parameters together to isolate exactly what you'd like to see. Lets start off with a few examples, and then explain.
Let us assume that we would only like to see traffic on port 80. It doesn't matter if its coming from port 80, or if its going to port 80, I just want to see it. In our query box we would type:
port 80
Simple huh? Here is what that looks like on my Network Analyzer test server:
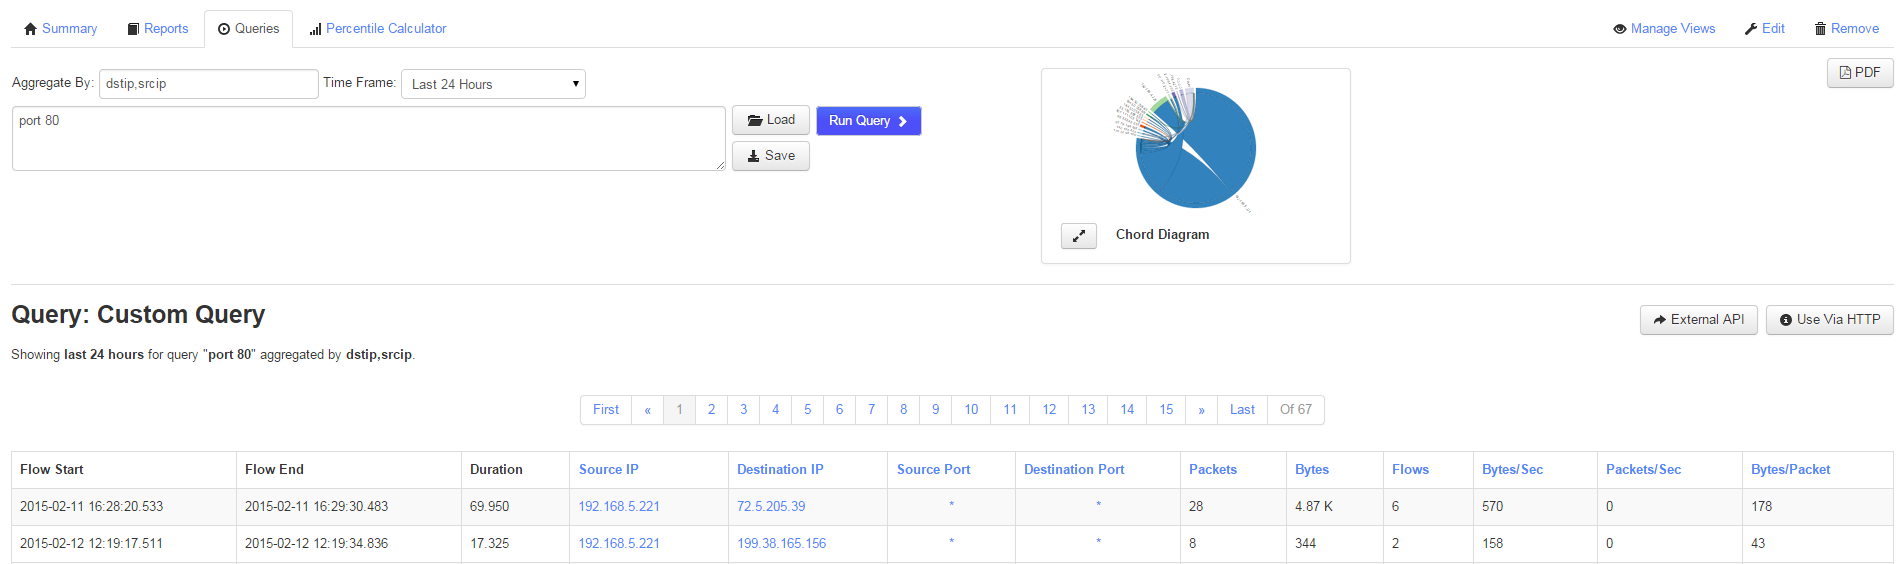
This shows all srcip,dstip aggregates that are talking on port 80. This actually brings up a good point, lets add srcport,dsport to our aggregate values.

Notice how many pages of entries we have now, 4,750 pages times 20 entries per page gives us 95,000 entries! But if you scroll through them you'll notice they all have port 80 as one of their ports. Now we decide that we only want to see it when the source port is 80, so lets amend our query to:
src port 80
Note the space between the src and port. Now we're limited to only src port.This means that we will no longer see any destination ports of port 80 unless it's going from src port 80 to dest port 80.
Lesson 1 - Placing src or dst in front of a ip, port or net expression makes it directional.
On that note, lets change our query to query for IP address:
ip 192.168.5.70
This will show us any flow that has a source or destination IP of 192.168.5.70. The same src and dst rules apply to it! Now change it to net to specify a network:
net 192.168.5.0/24
Notice we specify a network by using the slash notation. This will return all traffic that had anything to do with 192.168.5.0/24! Be careful! That's a big query. By leveraging the src and dst notation within a query, can significantly reduce the amount of data you have to sift through to find what you're looking for.
Lesson 2 - Use AND and OR to combine two expressions.
Alright, so now we've gotten basic filtering expressions based upon ports, ips and networks. Let's combine them in a real-world use case. Problem: If I would like to see traffic coming from the 192.168.5.0/24 network and going to port 80, the two queries I would use to symbolize the individual metrics would be:
src net 192.168.5.0/24
dst port 80
But we can combine these queries into one. The filtering syntax supports AND and OR. So if we want to see all the traffic that satisfies both of these, we would use:
src net 192.168.5.0/24 AND dst port 80
Now we just filtered our netflow data by network and port! Multiple AND and OR chains can be applied per query and can be as granular as you deem necessary. Additionally, you can add parentheses to your expression to make it clear how the query will be executed, take the following query for instance:
src net 192.168.5.0/24 AND dst port 80 OR src port 22
This isn't incredibly clear how it will evaluate. To ensure our query shows what we want, we can add parentheses to the string:
src net 192.168.5.0/24 AND (dst port 80 OR src port 22)
Now we know this expressions will show all traffic coming from the 192.168.5.0 network that has a dst port of 80 or a src port of 22.
Lesson 3 - Use NOT to prefix expressions that you want to negate.
Yields all flows that do not originate from network 192.168.5.0/24. NOT also does not require src or dst and can be applied to an expression. Leverage this to your advantage to exclude IP, networks or ports! Example:
not src net 192.168.5.0/24
Lesson 4 - Use metric types to filter our measurable values.
Not only can you filter by address/port values, but also by the amount of traffic that went through for each flow. For instance, you can filter for entries that have a certain amount of traffic associated with them. Perhaps you'd like to check if there was any traffic to port 22 where less than 1000 bytes were exchanged:
dst port 22 AND bytes < 1k
So you see, we combined the dst port expression we learned earlier, and use the AND combiner that we learned earlier, and added the bytes < 1k. This will only show us flows that had less than 1,000 bytes associated with them. You are not limited to < and > operators either, you can use = as well. Also notice that 1k was used instead of 1000, you can use 1000, but the scaling factor k is more convenient. Other scaling factors allowed are m and g.
Notice above we filtered by bytes, but we are certainly not limited to that. You can choose from packets, bytes, flows, So to get all flows that had a bps of more than 1MB you would use:
bytes > 1m
Try it! And then apply it to your situation.
This concludes the raw query documentation. But we did not comprehensively cover all abilities of the query syntax. If you would like to read more, you can get it here.
Save & Load Buttons
Did you create a long query and would like to run it again? Hit that Save button and make sure you keep it for as long as you need. Create queries that are tailored to your environment and use them to your advantage.
Final Thoughts
For any support related questions please visit the Nagios Support Forums at:


