VMHost Wizard Graph issues (using "Max" value not Last)

This support forum board is for support questions relating to Nagios XI, our flagship commercial network monitoring solution.
Locked
snowmirage
Posts: 1
Joined: Mon Oct 06, 2014 7:03 pm

VMHost Wizard Graph issues (using "Max" value not Last)

Post by snowmirage »

I used the configuration wizard in Nagios XI 2014R1.5 to setup monitoring for VMware host (ESXi 5.1). After following the instructions for adding the VMware SDK (if you're searching for it look at the Nagios Manual its in there) everything seemed to work fine.

The only problem I have is the data values it is using to monitor most of the items. When I visit the Home > Details > Service Detail page I can see the following

Image

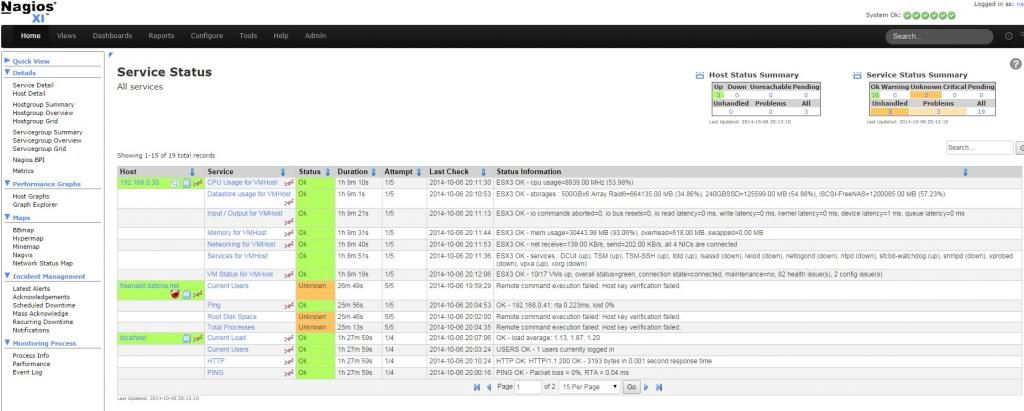
The data is getting there but for example the Memory when I view that graph like below it has all the data.

Image

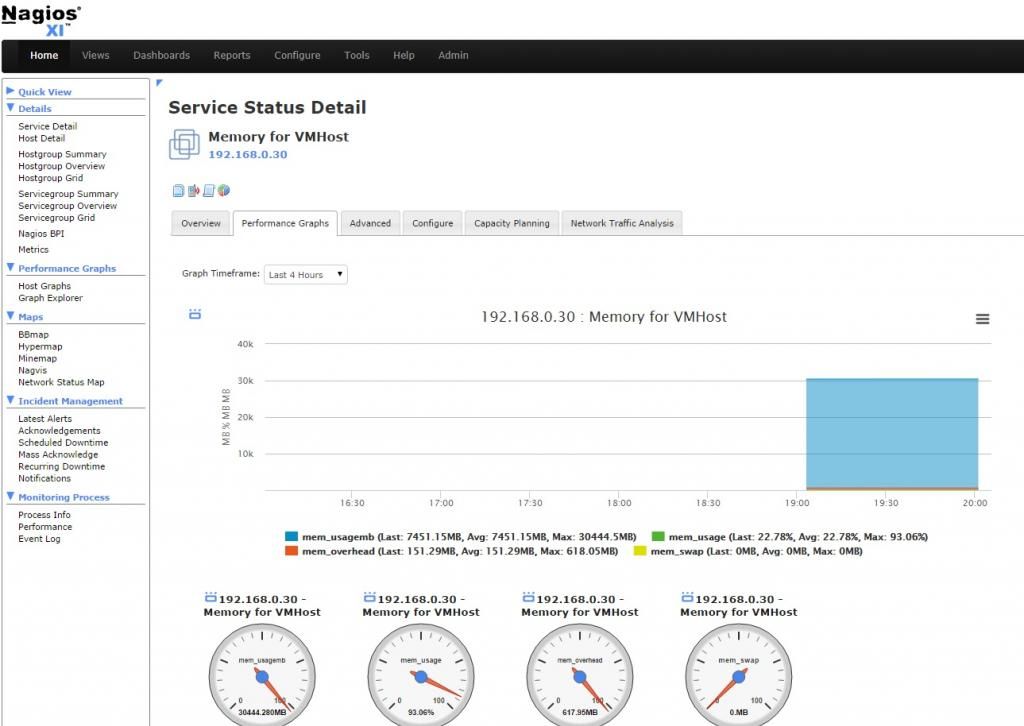
and you can see the LAST AVG and MAX for each for memory, CPU, Datastore usage etc...

But it keeps using the "Max" field data. So the graph above is monitoring if I ever change the amount of RAM in the host instead of how much of the ram is being used.

But the data is there I'm just not sure where I can find this code / scripts / config to go manipulate it to fix it.

Any chance someone can point me in the right direction?

Searched the forums all over was surprised I couldn't find anyone else mention this.
abrist
Red Shirt
Posts: 8334
Joined: Thu Nov 15, 2012 1:20 pm

Re: VMHost Wizard Graph issues (using "Max" value not Last)

Post by abrist »

Could you post the service check configuration for this memory check?
Additionally, could you post the contents of "performance data" in the table on the advanced tab?
Former Nagios employee
"It is turtles. All. The. Way. Down. . . .and maybe an elephant or two."
VI VI VI - The editor of the Beast!
Come to the Dark Side.
slansing
Posts: 7698
Joined: Mon Apr 23, 2012 4:28 pm
Location: Travelling through time and space...

Re: VMHost Wizard Graph issues (using "Max" value not Last)

Post by slansing »

Well, it looks like it reports those three metrics, which are then displayed on the graph, last (what you probably want) max, and average. So correct me if I am wrong but it should already show you what you are looking to get? If you are trying to somehow combine and average them that is not do-able, you would need to alter how the plugin actually returns those metrics in performance data. If you could be a bit more specific as to exactly what you want to change that would be helpful, in addition to what abrist asked, thanks!
Locked