I have a graphing issue I need to try and resolve if possible. It's a bit of an odd one!
The devices in question are our core switches, there are over 200 ports on each and these are working and graphing fine, however last week we had to open up a few more ports. So I went through the process of adding them to Nagios via the wizard (Like I have done many times in the past), everything went fine and the new ports were added into monitoring. However I later noticed the ports in question were not graphing while the rest of the switch was and still is graphing fine.
I just added the new ports to our test server as well, and they are working fine on there, so it looks like an issue with our production box not processing the incoming perf data as the graphs just sit at zero all the time.
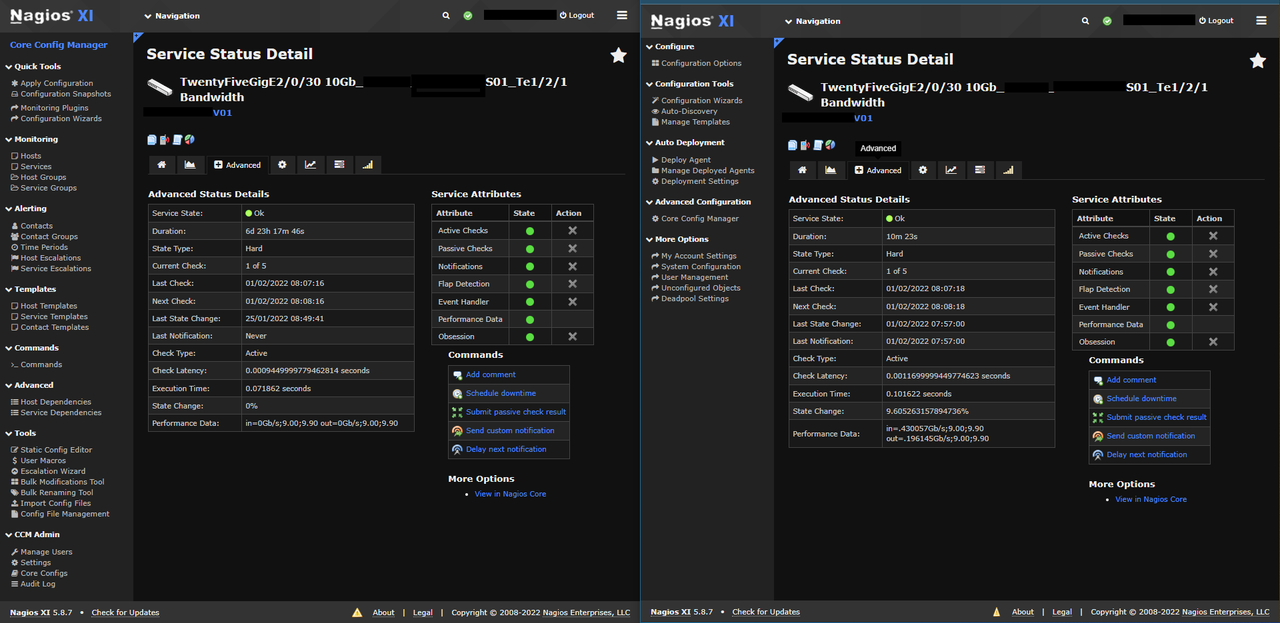
On the below screenshot is a side by side of my prod and test environments, same switch, same port. On test (the right) it is graphing fine as you can see by the Perf data being received from the switch, yet on the left, our production environment (the left) is not displaying that info and the graph is sat at zero.
I have removed and re-added the ports to the switch, but I get the same each time. Any ideas what would be causing this?
This is the raw output from the CLI.
Test Server
Code: Select all
[root@nagxit02 libexec]# ./check_rrdtraf -f /var/lib/mrtg/192.168.232.250_84.rrd -w 9.00,9.00 -c 9.90,9.90 -l G
OK - Current BW in: 1.48Gbps Out: .74Gbps|in=1.487830Gb/s;9.00;9.90 out=.743094Gb/s;9.00;9.90
Code: Select all
[root@nagxip02 libexec]# ./check_rrdtraf -f /var/lib/mrtg/192.168.232.250_84.rrd -w 9.00,9.00 -c 9.90,9.90 -l G
OK - Current BW in: 0Gbps Out: 0Gbps|in=0Gb/s;9.00;9.90 out=0Gb/s;9.00;9.90