;)

;)
;)

;)
;)

;)
;)
;)
;)
;)
;)
;)
;)
;)

;)
;)
;)
;)

;)

;)
;)
;)

What Are Performance Counters?
As per Microsoft's documentation, performance counters are measurements of system state or activity. They can be included in the operating system or can be part of individual applications. Windows Performance Monitor requests the current value of performance counters at specified time intervals.
Windows comes bundled with default performance counters and different applications can add in new counters that can be monitored.
An example of a counter is how much memory is available to the operating system. Lets look at this counter.
On a Windows machine, open Performance Monitor (perfmon.exe)
Navigate to Performance > Monitoring Tools > Performance Monitor
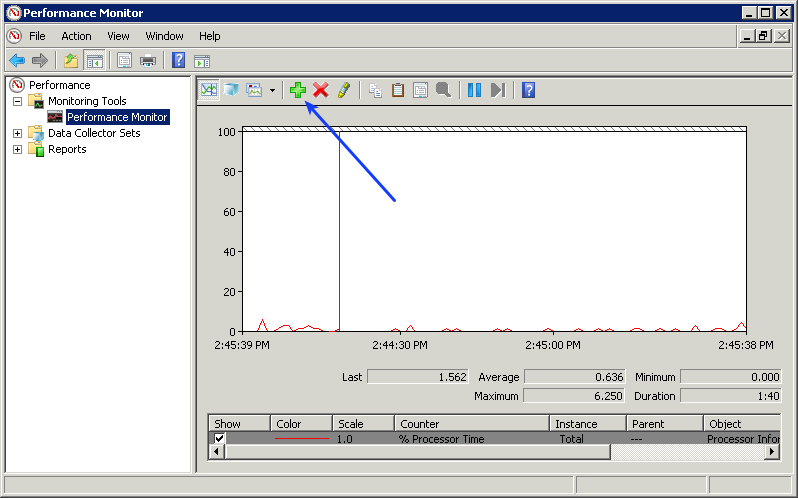
In the screenshot above you can see the Performance Monitor application open.
Click the + sign on the toolbar
A screen appears that allows you to browse the available counters
In the left pane find and expand Memory
Select Available MBytes
Click the Add >> button
It will now appear in the right pane
Click OK

Now you will see the counter added to the screen and the graph will update every second. Most importantly is the information under the graphs, specifically the "Last" field, this is the value that we will collect every time we check a performance counter.

It's worth mentioning here that when you query a performance counter, it is just for that second in time. If you monitor a performance counter every five minutes in Nagios, you are looking at data once in every 300 seconds. For intermittant issues, monitoring a performance counter might not be useful. However for consistent issues, like high processor usage or network interface bytes transmitted it may highlight activity that you were completely unaware of.
How Counters Are Referenced
When querying performance counters through NSClient++ there is a specific way in which you reference them. Following on from the past steps in Performance Monitor:
Right Click the counter Available MBytes and click Properties

Now you will be shown a list of currently selected performance counters:

The way they appear is how you will reference them in your monitoring:
\Memory\Available MBytes
As you can see from the last screenshot, there are two similar performance counters:
\Processor(_Total)\% User Time
\Processor(0)\% User Time
The different from the last one is there is either (_Total) or (0).
Some performance counters can have multiple objects of the same type available. In this case, there is a performance counter for the entire computer (_Total) AND also for the individual CPU cores (0). A computer with four cores will have (0), (1), (2), and (3) counters available. Another example of this is disk performance counters:
\LogicalDisk(C:)\% Disk Read Time
\LogicalDisk(D:)\% Disk Read Time
You can see that the different drive letters are referenced in the brackets.
Agent Differences In Referencing
NSClient++
- There is a space between Available and MBytes,you will need to enclose the entire counter in quotes (double " or single ' )
- Use double backslashes \ for ALL backslashes:
"\\Memory\\Available MBytes"
"\\Processor(_Total)\\% User Time"
"\\Processor(0)\\% User Time"
'\\LogicalDisk(C:)\\% Disk Read Time'
'\\LogicalDisk(D:)\\% Disk Read Time'
NCPA
- Prepend the counter with windowscounters/
- There is a space between Available and MBytes, you will need to use %20 to emulate the space
- Use forward slashes / for ALL backslashes \:
'windowscounters/Memory/Available%20MBytes'
'windowscounters/Processor(_Total)/%%20User%20Time'
'windowscounters/Processor(0)/%%20User%20Time'
'windowscounters/LogicalDisk(C:)/%%20Disk%20Read%20Time'
'windowscounters/LogicalDisk(D:)/%%20Disk%20Read%20Time'
You can see that the different drive letters are referenced in the brackets.
You can also confirm the counter can be accessed by accessing the NCPA API:
https://ncpa_address:5693/API/windowscounters/LogicalDisk(C:)/%%20Disk%20Read%20Time
Summary
At this point you should have an understanding of what a performance counter is in the Microsoft Windows Operating system. You might be interested in the next article, Monitoring Performance Counters in Nagios.
Final Thoughts
For any support related questions please visit the Nagios Support Forums at:


