;)

;)
;)

;)
;)

;)
;)
;)
;)
;)
;)
;)
;)
;)

;)
;)
;)
;)

;)

;)
;)
;)

Monitoring Performance Counters in Nagios Using NCPA
This article describes how you can monitor Windows Performance Counters in Nagios XI. This article will show you how to do this using Core Configuration Manager (CCM).
This article is going to focus on the following performance counter:
"\Memory\Available MBytes"
Which is referenced by NCPA in the following format:
'windowscounters/Memory/Available%20MBytes'
Note: When spaces are involved, %20 is required to emulate the space:
Warning threshold will be set to 500 and critical 256.
Requirements
You need to install NCPA to be able to monitor performance counters in Nagios XI. Please refer to the installing NCPA KB article if you have not already done so.
You will also need to have the host already monitored by Nagios XI (you can do this using the NCPA wizard). In this example, the host is called win7-01 and the host has the token uumrdrd3p704.
Create The Service
Click the Configure menu
Click Core Configuration Manager
In the left pane under Monitoring click Services
Click the Add New button
Populate the fields on each tab as follows:
Common Settings
| Config Name | win7-01 |
| Description | Memory Available |
| Manage Hosts button | Select win7-01 |
| Manage Templates button | Select xiwizard_ncpa_service |
| Check command | check_xi_ncpa_agent |
| $ARG1$ | -t 'uumrdrd3p704' -P 5693 -M 'windowscounters/Memory/Available%20MBytes' -w 500: -c 256: |
Check Settings
| Check interval | 5 |
| Retry interval | 1 |
| Max check attempts | 5 |
| Check period | xi_timeperiod_24x7 |
Alert Settings
Complete any notification options as required
Click Save
Click Apply Configuration
Now the settings have been applied, click the magnifying glass on the right of the menu bar.
Search for Memory Available
In the search result, click on the new service Memory Available
You should see something like the following:
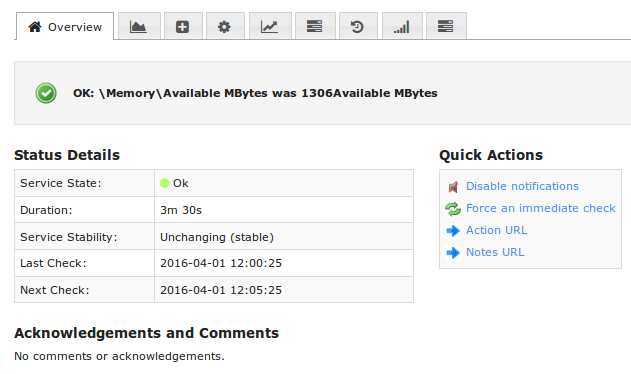
This completes monitoring a performance counter using NCPA.
Summary
At this point you should have an understanding of how to configure Nagios XI to monitor performance counters.
Final Thoughts
For any support related questions please visit the Nagios Support Forums at:


