;)

;)
;)

;)
;)
;)

;)
;)
;)
;)
;)
;)
;)
;)
;)
;)
;)
;)
;)
;)
;)
;)
;)
;)
;)
;)
;)
;)
;)
;)

;)
;)
;)
;)
;)
;)
;)
;)
;)
;)
;)

Overview
This KB article explains how you can customize the network status map in Nagios XI. The aim of the article is to educate you on how you can open the map to specific layouts by customizing the URL in your web browser. You can then use those URL in custom Views and Dashboards to save these customizations.
The status map is an integration of the Nagios Core status map, accessed in the left navigation pane under Maps > Network Status Map. As of Nagios XI 5.3.0 the map provided is the modern map that was introduced in Nagios Core 4.1.0. If you are interested in using the legacy network status map please refer to the following KB article:
Nagios XI - Network Status Map Customization (Legacy)
All of the options that are available in the map in Nagios Core are also available in Nagios XI, however the URL is slightly different and this KB article will explain how to use it in XI. You will need to refer to the following KB article first to understand the options that are available as this knowledge will greatly help understand this KB article:
Nagios Core - Status Map Customization
Map Basic URL
The Nagios XI interface does not provide much customization in regards to the default views available when accessing the map, however the map itself is simply a URL that can be customized.
The first example is to show a default map and the corresponding URL. In your Nagios XI web interface Navigate to Home > Maps and while holding CTRL on your keyboard click the Network Status Map link. This will open the map in a new browser window or tab. If this did not work right click on the Network Status Map link and select to open in a new window / tab. You will be presented with a map similar to the following:
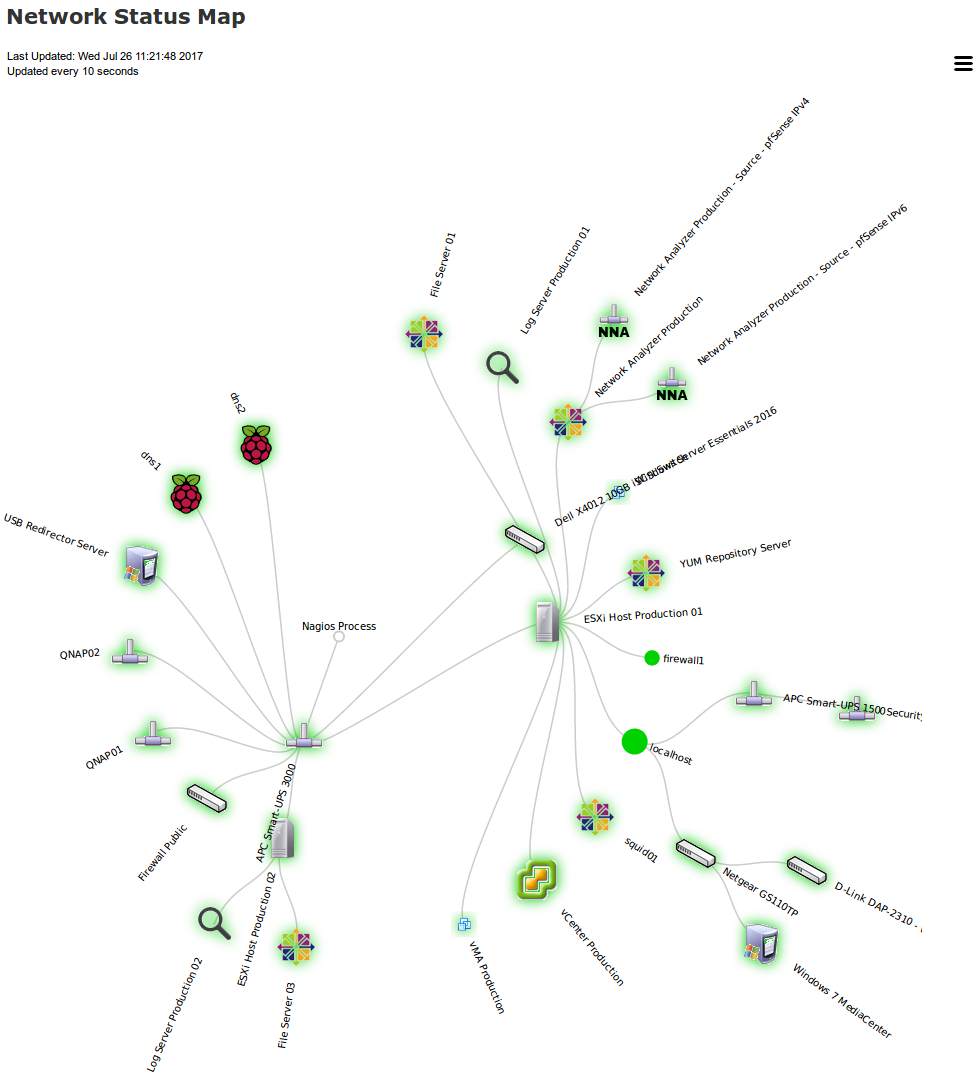
In the web browser address bar have a look at the URL, it will be something like:
https://10.25.5.1/nagiosxi/includes/components/statusmap/index.php
The index.php is how the map is called.
Using a question mark (?) after index.php is how you pass arguments to the map, currently there are no arguments being passed. Any additional arguments are separated with an ampersand (&) and this is demonstrated in the Options section in this KB article.
With that in mind, let's add an argument like ?host=firewall1 which will update the page as follows:
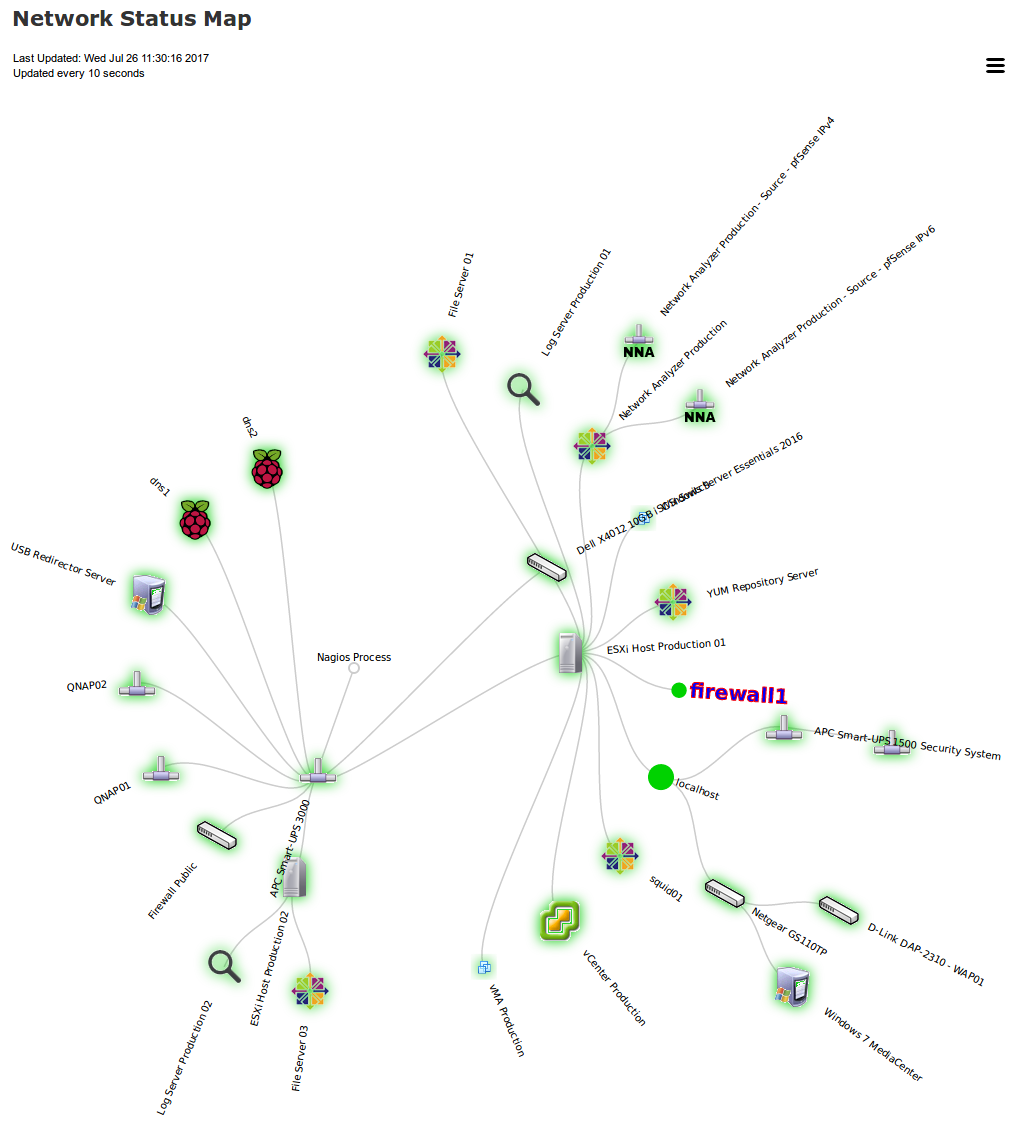
You can now see that the firewall1 object has been highlighted.
If you experience troubles you can try using map.php instead.
The previous screenshots use the Circular (Balloon) layout, you can change the layout when viewing the page by defining the argument layout=x. Here are the available options:
| Value | Layout Method |
| 0 | User Supplied |
| 1 | Depth Layers (Horizontal) |
| 2 | Collapsed Tree (Horizontal) |
| 3 | Balanced Tree (Horizontal) |
| 4 | DO NOT USE |
| 5 | Circular Markup |
| 6 | Circular Balloon |
| 7 | Balanced Tree (Vertical) |
| 8 | Collapsed Tree (Vertical) |
| 9 | Depth Layers (Vertical) |
| 10 | Force Map |
Example: You can use the Depth Layers (Vertical) layout to view Parent / Child relationships.

All of the options described in the following KB article can be used in Nagios XI:
Nagios Core - Status Map Customization
Here is an example of using several options:
https://10.25.5.1/nagiosxi/includes/components/statusmap/index.php?layout=5&root=firewall1

Add Map View
In Nagios XI you can add a URL as a view, hence using your custom URL allows you to add this map to your list of Views that get displayed in the rotation.
In Nagios XI navigate to Views and under View Tools click Add New View.
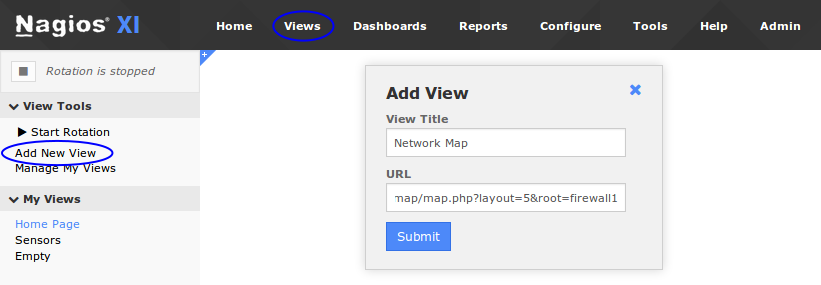
Provide a View Title and then in the URL field provide the custom status map URL, for example:
https://10.25.5.1/nagiosxi/includes/components/statusmap/index.php?layout=5&root=firewall1
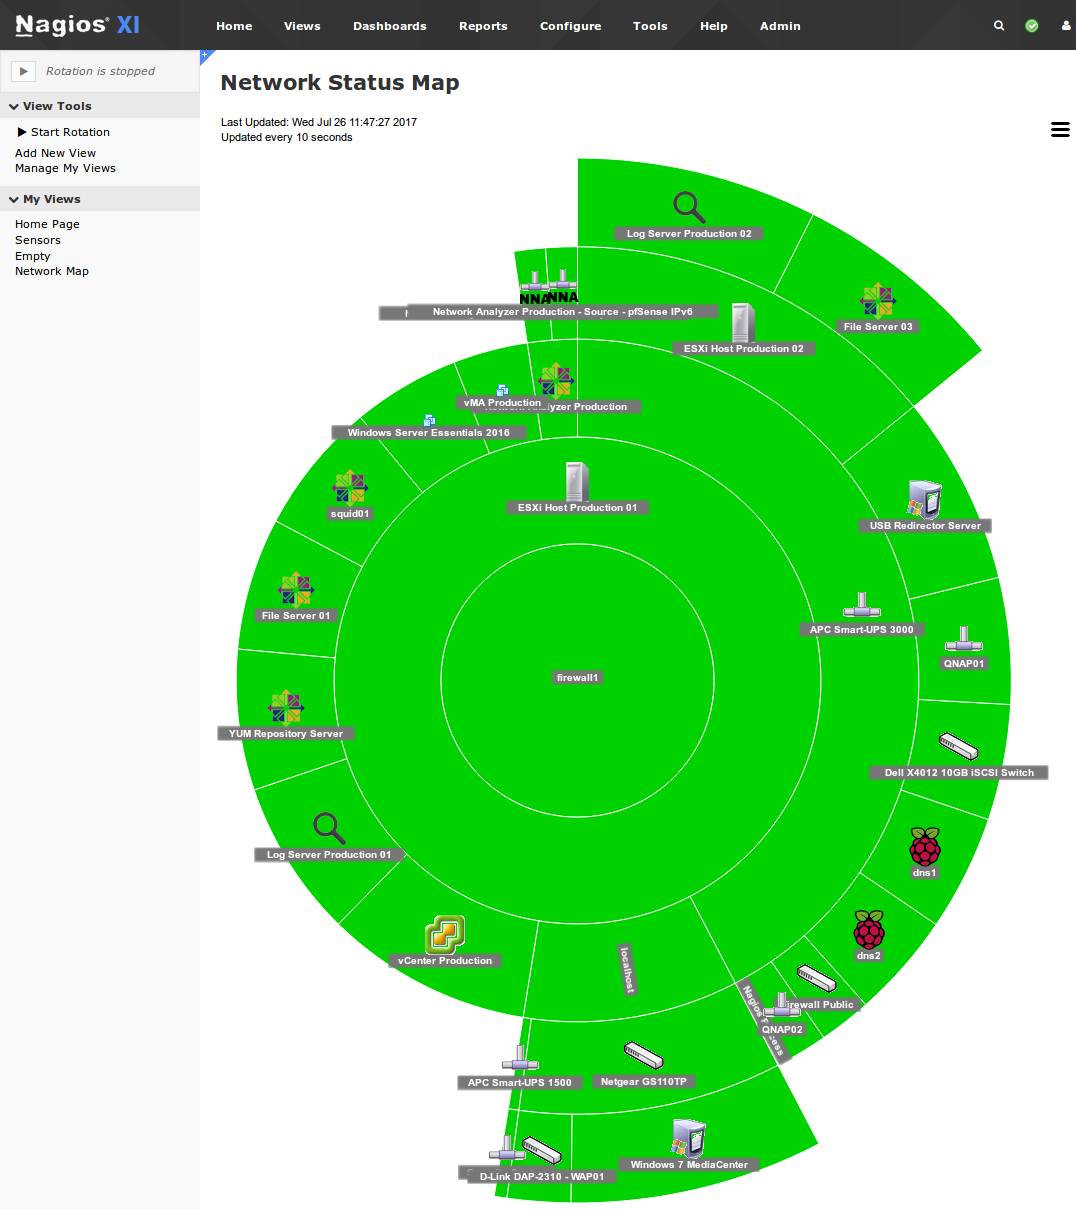
Click the Submit button. Once the screen refreshes click the new view under My Views and it should appear like this:
Add Map Dashboard
In Nagios XI you can add a URL to a dashboard using the Custom URL dashlet. The first step is to create a dashboard so navigate to Dashboards and under Dashboard Tools click Add New Dashboard.
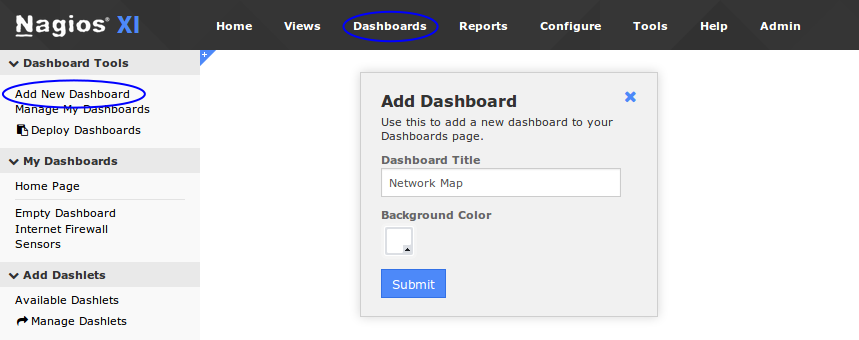
Provide a Dashboard Title and then click the Submit button. You have now created an empty dashboard.
The next step is to add a dashlet to the dashboard. Under Add Dashlets click the Available Dashlets link. Locate the Custom URL Dashlet and then click the Dashify icon in the top left corner of the dashlet.

You will now need to provide a Dashlet Title and select the Dashboard you created in the last step.
In the Dashlet URL field provide the custom status map URL, for example:
https://10.25.5.1/nagiosxi/includes/components/statusmap/index.php?layout=5&root=firewall1
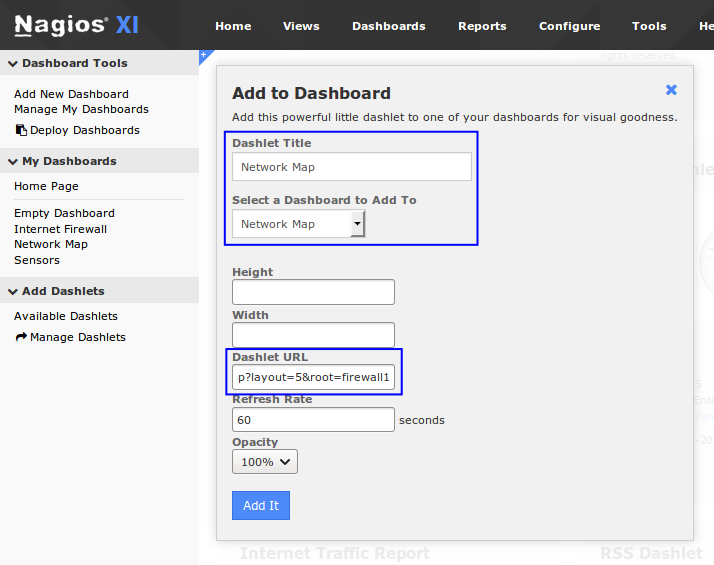
Click the Add It button. Once the screen refreshes click the dashboard under My Dashboard and it should appear like this (you will need to resize the dashlet with your mouse):

Final Thoughts
For any support related questions please visit the Nagios Support Forums at:


