;)

;)
;)

;)
;)
;)

;)
;)
;)
;)
;)
;)
;)
;)
;)
;)

;)
;)
;)
;)
;)
;)
;)
;)
;)
;)
;)
;)
;)
;)
;)
;)
;)
;)
;)
;)
;)
;)
;)
;)
;)

Recurring Downtime Overview
Nagios XI gives you the ability to schedule downtime that re-occurs on a regular basis. This is called recurring downtime. This document describes the components of the recurring downtime system, as well as troubleshooting information.
Recurring Downtime Architecture
An architectural overview of the recurring downtime system is shown in the image below. A detailed description of each step follows later.
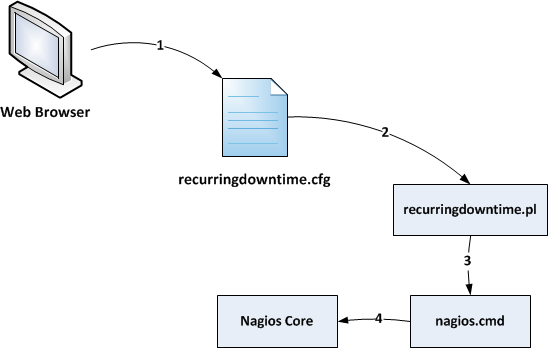
The recurring downtime system shown in the image above works as follows:
-
When you use the Nagios XI UI to define recurring downtime schedules, the schedules are written to the /usr/local/nagios/etc/recurringdowntime.cfg file on your XI server.
-
The recurring downtime cron job (/usr/local/nagiosxi/cron/recurringdowntime.pl) reads the config file periodically and determines if any hosts or services should go into downtime.
-
If the cron job determines that a host or service should enter downtime (based on the schedule you defined in the web UI), it will send a downtime command to the Nagios Core monitoring engine via its external command pipe (/usr/local/nagios/var/rw/nagios.cmd).
-
The Nagios Core monitoring engine reads the external command pipe and puts the required host or service into scheduled downtime.
Troubleshooting Problems
If you have problems with recurring downtime not working properly, check the following items:
-
Ensure the recurring downtime configuration file has the correct ownership and permissions, as shown below:
-
-rw-rw-r-- 1 apache nagios 0 Jan 2 2012 /usr/local/nagios/etc/recurringdowntime.cfg
-
-
Ensure the recurring downtime configuration is being written to the /usr/local/nagios/etc/recurringdowntime.cfg file
-
Make sure the recurring downtime cron job is running properly and not returning errors. You can do this by examining the recurring downtime log file (/usr/local/nagiosxi/var/recurringdowntime.log)
Final Thoughts
For any support related questions please visit the Nagios Support Forums at:


