;)

;)
;)

;)
;)

;)
;)
;)
;)
;)
;)
;)

;)
;)
;)

;)
;)
;)

Overview
This document describes how SNMP Traps work and integrate with Nagios XI.
SNMP means Simple Network Management Protocol. Devices that have SNMP functionality can provide active and passive monitoring.
- Active = The Nagios XI server initiates the connection to the SNMP enabled device to retrieve information
- Passive = The SNMP enabled device sends “Traps” to the Nagios XI server
This document is purely focused on SNMP Traps. Traps can be overwhelming to start with and the difficulty starts when you're trying to learn following other guides that aren't specifically about the device you're receiving traps from.
The goal of this tutorial is to provide step by step instructions to allow you to setup an test environment and see first hand how traps work. To make this as simple as possible we will use two Nagios XI servers and a CentOS server:
- SNMP Sender
- This server will SEND SNMP Traps to the receiving server. It is monitoring a single CentOS server which you will also be instructed to setup.
- This is achieved using the “SNMP Trap Sender” component built into Nagios XI
- SNMP Receiver
- This server will RECEIVE SNMP Traps from the sending server. Here you will receive status updates of the CentOS server being monitored on the sender server.
After following this document and deploying the test environment you will have a solid understanding of how SNMP Traps work and will be able to easily configure SNMP Traps received from real devices.
NOTE: The SNMP Sender server is purely used to provide the functionality of sending Traps to Nagios XI SNMP Receiving server, specifically for this tutorial. In your real world production environment this could be a UPS, Storage Array or any other SNMP Trap sending device. Just to be really clear, the SNMP Sender server is NOT required in your real world production environment, it is purely used as a training tool in this tutorial.
Target Audience
This document is intended for use by Nagios XI Administrators who wish to learn how SNMP Traps work.
You will need to be able to deploy a test environment using virtual machines (VM's). Using VM's allows us to use pre-installed Nagios XI templates and makes it relatively easy to follow this guide.
The Goal
The following diagram gives an overview of the test environment you will deploy.
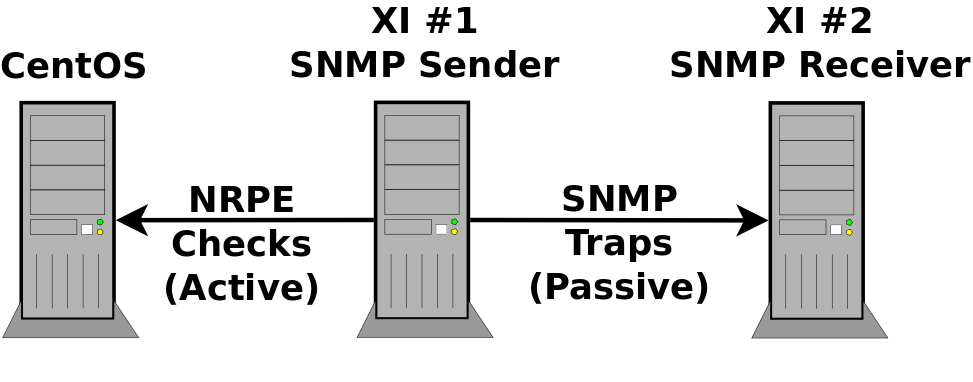
Here you can see the SNMP Sender server is monitoring a CentOS server using NRPE using active checks. Whenever a state changes occurs an any check on the SNMP Sender server it will send an SNMP Trap to the SNMP Receiving server.
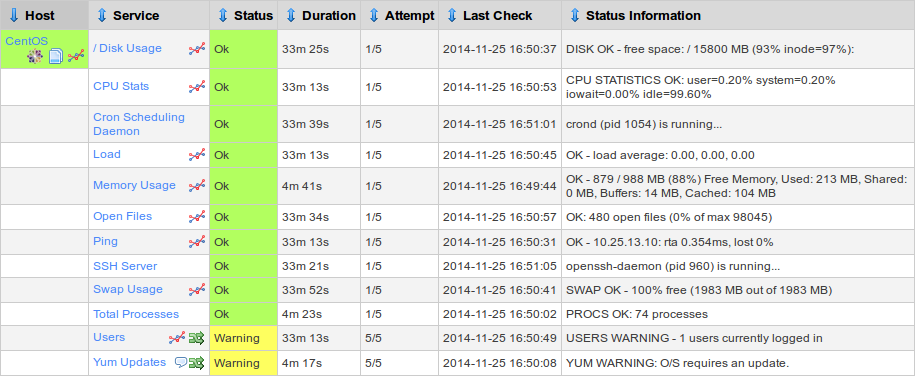
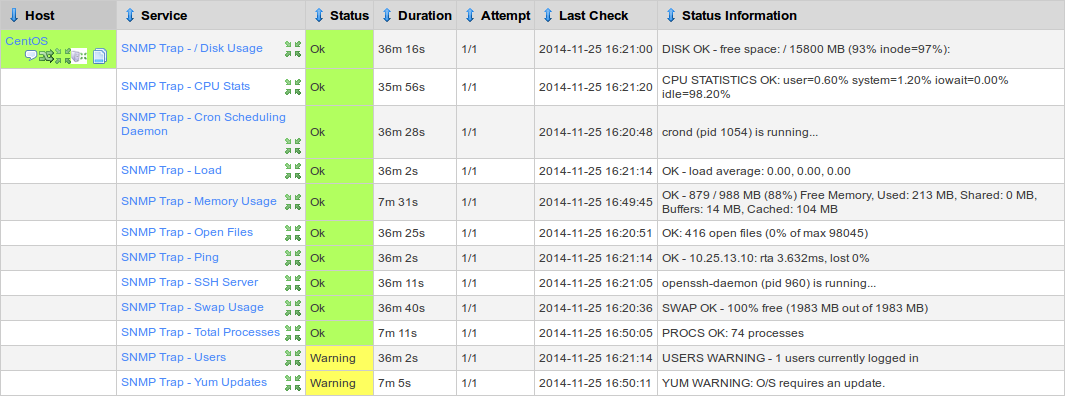
Below are two screenshots showing what this tutorial will show you how to do. The top screenshot is the SNMP Sender monitoring the CentOS sever and the bottom screenshot is the SNMP Receiving server configured with SNMP Trap services.
Deploy Environment
You need to create three VM's:
- CentOS 6.5
- 10.25.13.10/8
- A minimal install
- This will have the NRPE Agent installed on it
- Nagios XI SNMP Sender
- 10.25.5.20/8
- Use a Nagios XI VM downloaded from the Nagios Website (2014R2.6 +)
- Nagios XI SNMP Receiver
- 10.25.5.30/8
- Use a Nagios XI VM downloaded from the Nagios Website (2014R2.6 +)
NOTE: These VM's will require Internet access to install certain components. When prompted below you will need to define a valid default gateway and correct DNS servers. For the purposes of this tutorial I will be using a default gateway of 10.24.1.254 and a DNS server of 10.25.2.1.
CentOS 6.5 Installation
These steps were performed using CentOS-6.5-x86_64-bin-DVD1.iso
Boot the CentOS installer ISO
Select Install or upgrade an existing system
You can skip the media test
The GUI installer appears
Click Next
Select your language and click Next
Select your keyboard and click Next
Storage - For the purposes of this guide I am:
Selecting Basic Storage Device and click Next
Storage Device Warning
Tick the box Apply my choice to all devices with undetected partitions or filesystems
Click Yes, discard any data
Hostname
Leave hostname as default
Click Configure Network
Select System eth0
Click Edit
Tick the box Connect automatically
IPv4 Settings tab
Provide the static IP Address parameters (10.25.13.10/8)
Click Apply
Click Close
Click Next
Select your Timezone
Click Next
Provide a root password for this host
Click Next
Which type of install would you like - For the purposes of this guide I am:
Replace Existing Linux System(s)
Click Next
Click Write changes to disk
Select Minimal and click Next
Wait while the installation is performed
When the installation is complete click Reboot
Nagios XI SNMP Sender and Receiver
Deploy the two Nagios XI VM's and power them on
Once they have booted you will need to configure each one with it's static IP Address, follow these steps:
Access the Console of your Nagios XI VM
Username: root
Password: nagiosxi
Type:
system-config-network
Select Device configuration and press Enter
Select the network adapter eth0 and press Enter
Press the down arrow key twice
Press the space bar to disable DHCP
Press the down arrow key once
Type the Static IP Address
SNMP Sender = 10.25.5.20
SNMP Receiver = 10.25.5.30
Press the down arrow key once
Type the Netmask 255.0.0.0
Press the down arrow key once
Type the Default Gateway
Press the down arrow key once
Type the Primary DNS Server
Press the down arrow key twice
Press Enter on the OK button
Press the Tab button once
Press Enter on the Save button
Press the Tab button once
Press Enter on the Save & Quit button
Type:
ifdown eth0
Wait while the command completes
Type:
ifup eth0
Wait while the command completes
Type:
exit
At this point you should open a web browser to the two Nagios XI servers to complete the Nagios XI installation.
Now you have the three servers deployed ready to go. At this point it might be helpful to shut each one down and take a snapshot of it before continuing to allow you to go backwards if you make a mistake.
Install NRPE On The CentOS Server
Now you will install the NRPE agent on the CentOS server so we can monitor this server from our SNMP Sender Nagios XI server.
Establish an SSH session to the CentOS server
Type:
yum -y install wget openssl-devel
Type:
cd /tmp
Type:
wget http://assets.nagios.com/downloads/nagiosxi/agents/linux-nrpe-agent.tar.gz
Wait for the file to download
Type:
tar xzf linux-nrpe-agent.tar.gz
Type:
cd linux-nrpe-agent
Type:
./fullinstall
Type:
y
Wait for the fullinstall command to complete
When prompted, type the IP Address of the Nagios XI SNMP Sender:
10.25.5.20
Type:
exit
The NPRE Client / agent is now installed and listening on port 5666.
Monitor The CentOS Server From The SNMP Sender Nagios XI Server
Now run a Configuration Wizard to monitor the CentOS server.
Open a web page to http://10.25.5.20/nagiosxi
Click the Configure menu heading
Click the link Run the Monitoring Wizard
Click the heading Linux Server
In the IP Address field type:
10.25.13.10
Select the Linux Distribution CentOS
Click Next
In the Host Name field type:
CentOS
Accept all the defaults EXCEPT for:
Users:
Warning Number: 1
Critical Number: 2
Click Next
Click Finish
Wait while the wizard creates the services to monitor the CentOS server
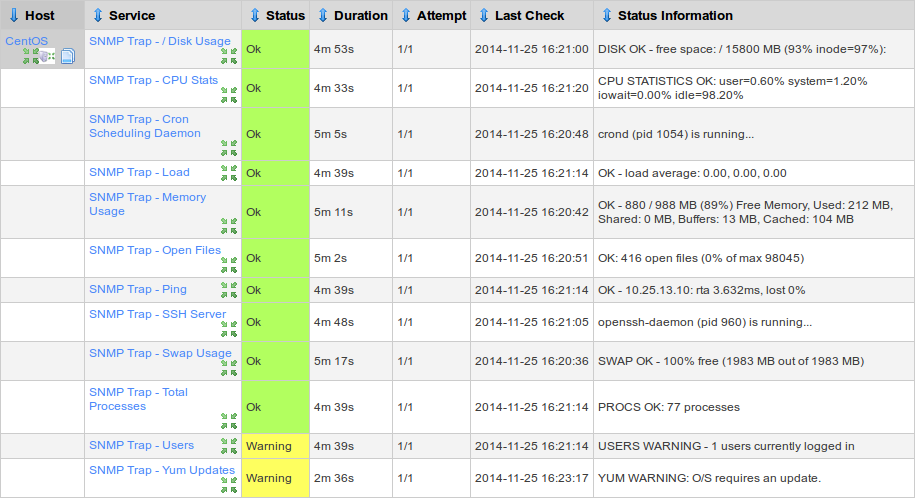
Click the link View status details for CentOS
In a couple of minutes all of these services will appear OK (some might have a warning state like Yum Updates)
Now you are monitoring this CentOS server and you will be using it in testing to trigger SNMP traps.
Install SNMPTT on Nagios XI SNMP Receiver Server
Now you'll install the required components on the Nagios XI SNMP Receiver server so it will accept SNMP Traps.
Establish an SSH session to the Nagios XI SNMP Receiver server
Type:
cd /tmp
Type:
yum -y install wget openssl-devel
Wait for the package to download / update
Type:
wget http://assets.nagios.com/downloads/nagiosxi/scripts/NagiosXI-SNMPTrap-setup.sh
Type
sh ./NagiosXI-SNMPTrap-setup.sh
Wait while the components are downloaded and installed
Type:
sed -i 's/.*mibs_environment.*/mibs_environment = ALL/g' /etc/snmp/snmptt.ini
Type:
sed -i 's/.*translate_integers.*/translate_integers = 0/g' /etc/snmp/snmptt.ini
Type:
service snmptt restart
Now the Nagios XI SNMP Receiver Server is ready to receive SNMP Traps.
Configure Nagios XI SNMP Sender Server
You have one last step to perform and your environment will be setup and sending SNMP Traps.
Establish an SSH session to the Nagios XI SNMP Sender server
Type:
cd /usr/local/nagiosxi/html/includes/components/snmptrapsender/
Type:
chmod +x install.sh
Type:
./install.sh
Wait while the components are downloaded and installed
Once completed type:
exit
Open a web page to http://10.25.5.20/nagiosxi
Click the Admin menu heading
Under System Extensions click Manage Components
Scroll down until you find SNMP Trap Sender
Click the Configure icon ![]()
Tick the box Enable Integration
Under trap hosts we need to provide the parameters of the SNMP Receiver Server
Host Address: 10.25.5.30
Port: 162
Click the Apply Settings button
You will get the message settings updated
While we are here you should save a copy of the MIBs available on this page as we will use them later on
Right click on NAGIOS-NOTIFY-MIB.txt and select Save Link As
Save the file to your desktop
Repeat for NAGIOS-ROOT-MIB.txt
Test Environment Deployment Complete
You have now completely setup the test environment and from here on the tutorial on SNMP Traps will being. At this point it might be helpful to shut each one down and take a snapshot of it before continuing to allow you to go backwards if you make a mistake.
Tutorial Process
The first part of the tutorial will show you:
- How traps are received
- Uploading MIBs
- Adding A SNMP Trap Service To Nagios XI
At this point you will have a basic understanding of how SNMP Traps are received by Nagios XI.
The second part of the tutorial will go into more detail:
- Reading MIBs and understanding OID's
- Creating SNMP Trap Events
At the end of the second part of the tutorial you should have a thorough understanding of how SNMP Traps work and at this point you should be able to determine how to configure SNMP Traps for your own SNMP enabled devices.
Tutorial Part 1
The focus in part one is to show you the working parts without going into too much detail (we'll save that for part two).
Here you will follow these steps to send a test trap to your SNMP Receiving Server. Here's what you'll do:
- Open the XI Web interface on the SNMP Sending server
- Observe the current state of the Users service for CentOS
- Establish an SSH session to the CentOS server
- Go back to the XI SNMP Sending server
- Schedule an immediate check of the Users service for CentOS
- Watch it go into the Warning State
- Establish an SSH session to the XI SNMP Receiving Server
- See the SNMP Trap that was logged
- Upload a MIB file to the SNMP Receiving Server
- Send another SNMP Trap
- See the SNMP Trap that was logged
- Add the SNMP Trap Service To SNMP Receiving Server
- Send another SNMP Trap
- See the service status on the SNMP Receiving Server
Observe Users Service
Open a web page to http://10.25.5.20/nagiosxi
In the Search field at the top type:
CentOS
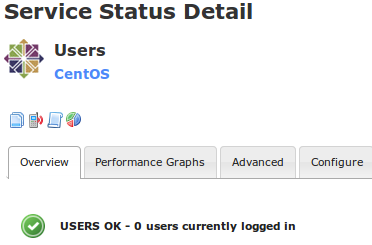
Click the Users service
It should look like the following picture:
SSH To CentOS Server
Establish an SSH session to your CentOS server
Minimize the SSH session as we only need it to establish a user login
Check Users Service To Force An SNMP Trap To Be Sent
Go back to the Nagios XI page with the Users service
Click the Schedule a forced immediate check link
Wait while it executes the check and the screen updates
It will now go into a Warning state and like the following picture:

Confirm SNMP Trap Is Received On SNMP Receiver
Establish an SSH session to your SNMP Receiving server
Type:
cat /var/log/snmptt/snmpttunknown.log
You will get an output similar to the following picture:
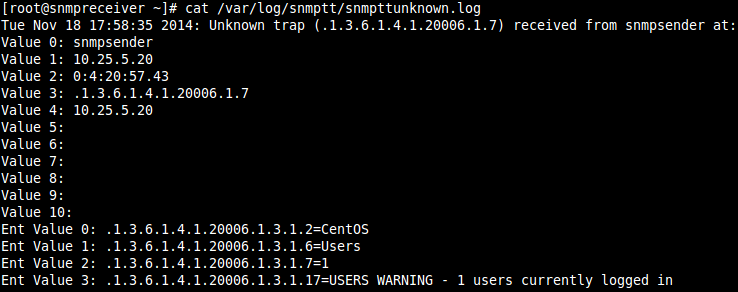
So what you have confirmed here is that the SNMP Receiving server successfully received a trap from the sending server. Right now it is not doing anything as it is going into the snmpttunknown.log file.
The snmpttunknown.log file is where traps go that the SNMPTT service does not know what to do with. The next step will be to upload MIBs.
Leave the SSH session to your SNMP Receiving server open as we will return to it shortly.
Before you continue, exit the SSH session on your CentOS server as this will return the service check back to an OK state.
Upload MIB Files
Remember those two files you saved to your desktop earlier? They were NAGIOS-ROOT-MIB.txt and NAGIOS-NOTIFY-MIB.txt. Now you will upload them to your SNMP Receiving server.
Open a web page to http://10.25.5.30/nagiosxi
Click the Admin menu heading
Under System Extensions click Manage MIBs
Click the Browse button
Navigate to your Desktop and double click the file NAGIOS-ROOT-MIB.txt
Leave the Process trap box un-ticked
Click the Upload MIB button
You will get a message New MIB was installed successfully
Click the Browse button
Navigate to your Desktop and double click the file NAGIOS-NOTIFY-MIB.txt
Tick the box Process trap
Click the Upload MIB button
You will get a message saying MIB file successfully processed
Return to your SSH session on your SNMP Receiving server
Type:
service snmptt restart
You will get a message saying the snmptt service stopped and started
Now that you have uploaded the Nagios SNMP MIBs, the Receiving server will now know what to do with the SNMP Traps it will receive.
Force An SNMP Trap To Be Sent
Now you will re-send that same trap again and observe what the SNMP Receiving server did this time.
Establish an SSH session to your CentOS server
Minimize the SSH session as we only need it to establish a user login
Open a web page to http://10.25.5.20/nagiosxi
In the Search field at the top type:
CentOS
Click the Users service
Click the Schedule a forced immediate check link
Wait while it executes the check and the screen updates, it will go into a warning state
Return to your SSH session on your SNMP Receiving server
Type:
cat /var/log/snmptt/snmptt.log
You will get an output similar to the picture below:

So what you have confirmed here is that the SNMP Receiving server successfully received a trap from the sending server AND it is recording it into the snmptt.log file. The snmptt.log file is a record of traps that were successfully processed by the SNMPTT service
Add SNMP Traps Service to SNMP Receiving Server
Now you will log into Nagios XI on the SNMP Receiving server and create the SNMP Trap service.
Open a web page to http://10.25.5.30/nagiosxi
Click the Admin menu heading
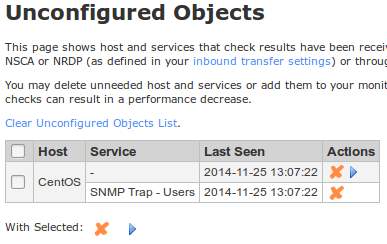
Under Monitoring Config click Unconfigured Objects
You should see something similar to the picture below:

In the Actions column click the Play button (Configure)
This opens the Passive Object Monitoring wizard at Step 3 as per the picture below:

Click Next
Click Finish
Wait while the wizard creates the SNMP Traps service
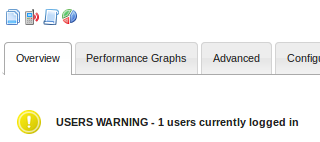
Click the link View status details for snmpsender
You will see a picture similar to below:

NOTE: this will display “No check results for service yet” as you need to send another trap before it gets updated.
Force An SNMP Trap To Be Sent And See Status On SNMP Receiving Server
Now you will re-send that same trap again and observe what the SNMP Receiving server did this time.
Return to your SSH session to your CentOS server
Type
exit
Open a web page to http://10.25.5.20/nagiosxi
In the Search field at the top type:
CentOS
Click the Users service
Click the Schedule a forced immediate check link
Wait while it executes the check and the screen updates, it will go into an OK state
Open a web page to http://10.25.5.30/nagiosxi
In the Search field at the top type:
SNMP Traps
Click the SNMP Traps service
You will see a picture similar to below:
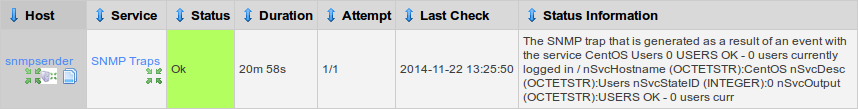
Now you can see the SNMP Traps service on the SNMP Receiving server has updated
There is quite a bit of information there, you will learn in Part 2 of this tutorial on how to optimize this
The key information here is "CentOS Users 0 OK – 0 users currently logged in"
Now SSH back into the CentOS server and force an immediate check on the Users service on the SNMP Sending server
This will enter a WARNING state again and will send another trap. It will look like the picture below:
On the SNMP Receiving server you will see that the SNMP Traps service looks like this:
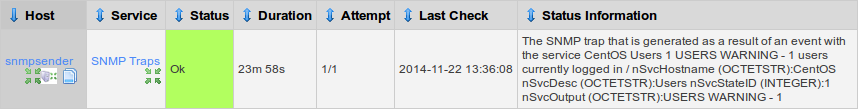
The key information here is "CentOS Users 1 WARNING – 1 users currently logged in"
However as you can see from the screenshot the actual service STATUS of the SNMP Traps service is "Ok" whereas on the SNMP Sending server it is WARNING. The reason for this is how we configure EVENTS in the SNMPTT service, which will be explained in Part 2 of the tutorial.
Tutorial Part 1 - Summary
The steps you have followed so far have given you a basic example of how SNMP traps are received and processed by Nagios XI. However as you have seen, it looks like there is more information than what is required and also the service state on the receiving server was not updated.
In Part 2 of the tutorial we'll delve into much detail about how this works and by the end you'll be on your way to mastering SNMP Traps.
Tutorial Part 2
This section of the tutorial will have a lot more detail. The basic topics you'll cover are:
- Showing how the current SNMP Trap Receiving configuration is basic and the limitations that come with this
- Explaining how to read a MIB and understanding OIDs
- Explaining how SNMPTT sends traps to Nagios XI
- Edit the SNMPTT configuration file to create custom EVENTS
What is SNMPTT? SNMP Trap Translator is the program that runs on the SNMP Receiving server. It takes the events from the SNMP Trap Daemon (SNMPTRAPD) service and figures out if it needs to perform an action with them or to ignore them.
SNMP Trap Receiving Configuration
At the end of part one you saw that when a SNMP Trap was received it came with a lot of information AND it did not correctly reflect the state of the service on the sending server. Here are some examples to highlight limitations of our current configuration:
Return to your SSH session to your CentOS server
Type:
service crond stop
Open a web page to http://10.25.5.20/nagiosxi
In the Search field at the top type:
CentOS
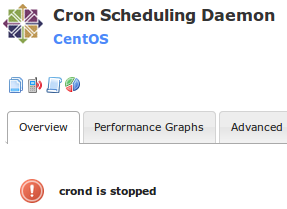
Click the Cron Scheduling Daemon service
Click the Schedule a forced immediate check link
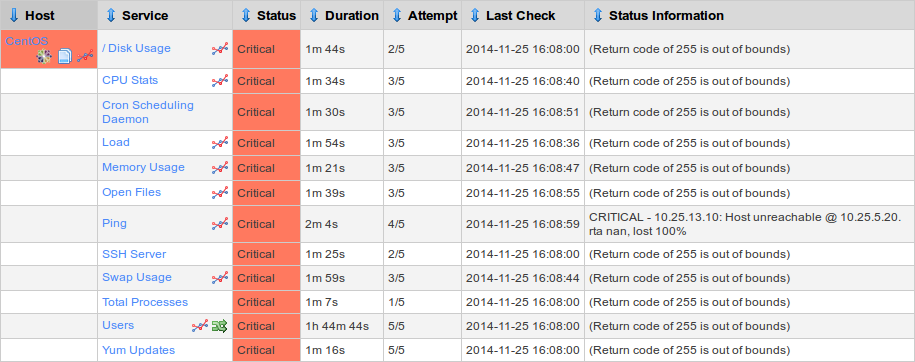
Wait while it executes the check and the screen updates, it will go into an CRITICAL state as per the picture below:
Open a web page to http://10.25.5.30/nagiosxi
In the Search field at the top type:
SNMP Traps
Click the SNMP Traps service
On the SNMP Receiving server you will see that the SNMP Traps service looks like the picture below:
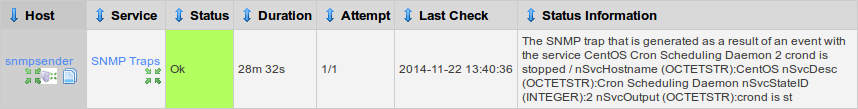
Here you can see it has updated the status to reflect the sending server HOWEVER we no longer have any information about the "Users service" which was the previous status
What was just demonstrated is that our current SNMP Trap configuration will only show the status of the last SNMP Trap received. In particular this SNMP Trap service is for ALL SNMP Traps that will come from the sending server (for everything that the sending server server monitors). You can imagine that this isn't exactly helpful.
All of this can be configured to make it more meaningful and useful. So far we have identified the following:
- A lot more information is being display than what is necessary
- The service status is not correctly reflected (always showing Ok)
- All traps are received on just one services
The next step is to learn about SNMP OIDs and MIBs.
OIDs and MIBs
What do these acronyms mean?
- OID = Object Identifier
- This string is a series of number numbers separated with periods (.)
- MIB = Management Information Base
- This is a text file containing all the information about specific OIDs and how they relate to each other
Here's a picture of that first SNMP Trap you received:
On the first line we have .1.3.6.1.4.1.20006.1.7
This is the OID
- Think of each number as a branch in a tree. Every time you have a period followed by another number you are creating another branch in the tree
- Eventually the last number will reference a value that is being sent (you could say it was a leaf)
- Think of it along the lines of “computer . motherboard . disk drive . file system . folder . file” (this is just a theoretical example)
For every company out there that has an SNMP enabled device, they would have applied to IANA (Internet Assigned Numbers Authority) to obtain their own Private Enterprise Number (PEN). Nagios has the PEN of 20006.
- So this means that in all of our OIDs, the first series of numbers will always be the same
- .1.3.6.1.4.1.20006 = Enterprises # 20006 = Nagios
- If for example you had a Dell device, their PEN is 674, so they would have:
- .1.3.6.1.4.1.674 = Enterprises # 674 = Dell Inc.
Now every number that follows 20006 will relate to a specific Nagios item. How do you know what each of the numbers mean? This is where a MIB comes into play. We have two MIB files NAGIOS-ROOT-MIB.txt and NAGIOS-NOTIFY-MIB.txt.
Here's a diagram of the two MIB files. Below is an explanation of how this all works:
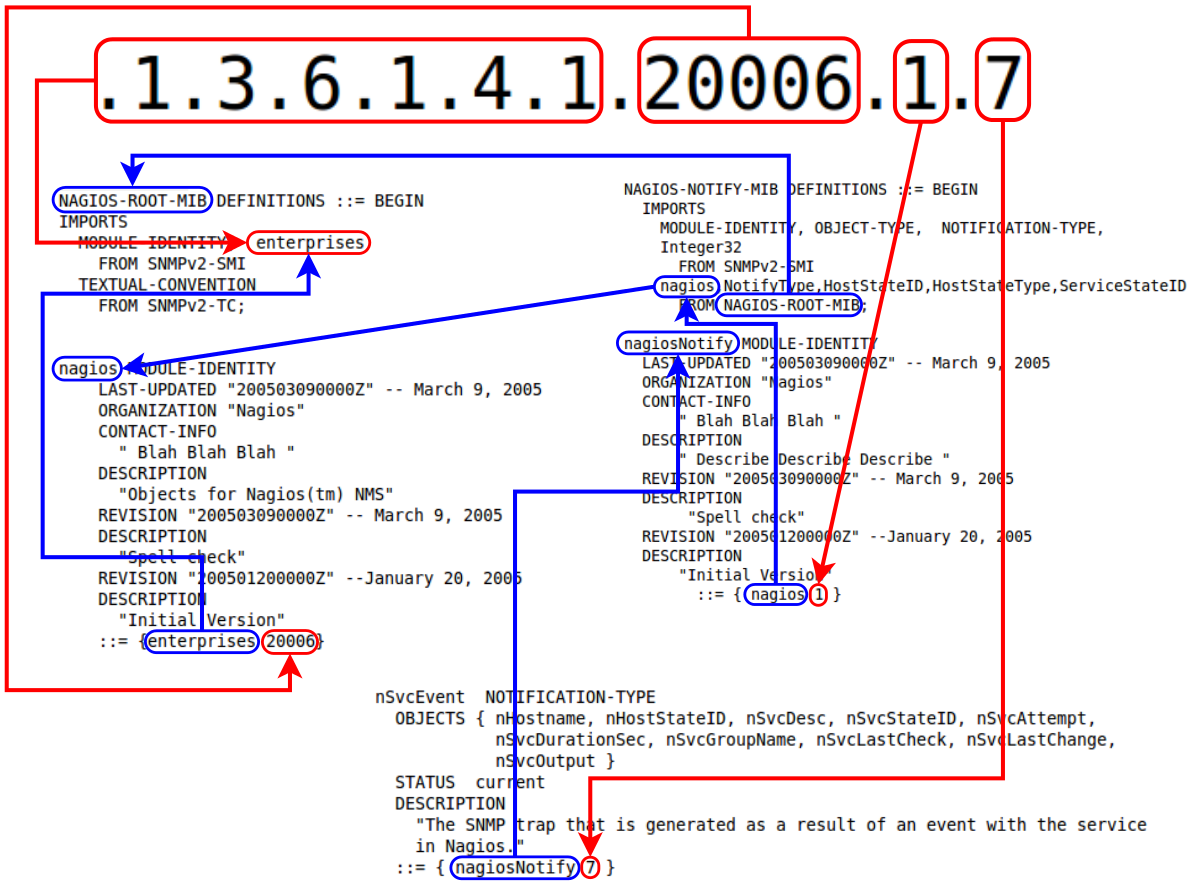
NAGIOS-ROOT-MIB.txt is the "top level" MIB file which the NOTIFY file relies on, here is an extract from the start of the file:
NAGIOS-ROOT-MIB DEFINITIONS ::= BEGIN
IMPORTS
  MODULE-IDENTITY,  enterprises
    FROM SNMPv2-SMI
  TEXTUAL-CONVENTION
    FROM SNMPv2-TC;

nagios MODULE-IDENTITY
    LAST-UPDATED "200503090000Z" -- March 9, 2005
    ORGANIZATION "Nagios"
    CONTACT-INFO
      " Blah Blah Blah "
    DESCRIPTION
      "Objects for Nagios(tm) NMS"
    REVISION "200503090000Z" -- March 9, 2005
    DESCRIPTION
      "Spell check"
                REVISION "200501200000Z" --January 20, 2005
    DESCRIPTION
      "Initial Version"
    ::= {enterprises 20006}
What is important here is the MODULE-IDENTITY which is called nagios. This contains all the information about this MIB and it ends with ::= {enterprises 20006}. What this means is that this module follows the enterprise OID (.1.3.6.1.4.1) and is number 20006, hence you end up with ".1.3.6.1.4.1.20006".
Now the remaining information you'll need to continue to decipher the OID will be defined in the NAGIOS-NOTIFY-MIB.txt file.
Here is an extract from the start of the NAGIOS-NOTIFY-MIB.txt file:
NAGIOS-NOTIFY-MIB DEFINITIONS ::= BEGIN
  IMPORTS
    MODULE-IDENTITY, OBJECT-TYPE,  NOTIFICATION-TYPE,
    Integer32
      FROM SNMPv2-SMI
    nagios,NotifyType,HostStateID,HostStateType,ServiceStateID
      FROM NAGIOS-ROOT-MIB;

nagiosNotify MODULE-IDENTITY
  LAST-UPDATED "200503090000Z" -- March 9, 2005
  ORGANIZATION "Nagios"
  CONTACT-INFO
      " Blah Blah Blah "
  DESCRIPTION
      " DESCRIBE DESCRIBE DESCRIBE "
  REVISION "200503090000Z" -- March 9, 2005
  DESCRIPTION
       "Spell check"
  REVISION "200501200000Z" --January 20, 2005
  DESCRIPTION
      "Initial Version"
        ::= { nagios 1 }
First, the IMPORTS section shows that it is importing nagios (PEN 20006) from the MIB file NAGIOS-ROOT-MIB.
Next is the MODULE-IDENTITY which is called nagiosNotify. This contains all the information about this MIB and it ends with ::= {nagios 1}. What this means is that this module follows the nagios OID (.1.3.6.1.4.1.20006) and is number 1, hence you end up with ".1.3.6.1.4.1.20006.1".
Going back to our original OID number it is:
.1.3.6.1.4.1.20006.1.7
To find this in the NAGIOS-NOTIFY-MIB.txt file, all you need to do is search for:
::= { nagiosNotify 7 }
Which results in the following:
nSvcEvent  NOTIFICATION-TYPE
  OBJECTS { nHostname, nHostStateID, nSvcDesc, nSvcStateID, nSvcAttempt,
            nSvcDurationSec, nSvcGroupName, nSvcLastCheck, nSvcLastChange,
            nSvcOutput }
  STATUS  current
  DESCRIPTION
    "The SNMP trap that is generated as a result of an event with the service
    in Nagios."
  ::= { nagiosNotify 7 }
What this means is that the OID .1.3.6.1.4.1.20006.1.7 is an SNMP Trap that was generated as a result of a service event in Nagios. This makes sense because:
- You had a service on the sending server that you forced an immediate check to be scheduled
- The check triggered a threshold which made it enter a warning state
- The sending server sent a trap to the receiving server
- The trap received contained the data
One last thing to point out is that this trap contains OBJECTS. So instead of the trap just being a value like "87" or "NIC DOWN" it contains multiple values such as nHostname, nHostStateID, etc. NOTE: These are the objects that can be sent in the trap, it does not mean ALL these objects will be sent with each trap.
Going back to the original trap, you can see all the different values are OBJECTS in this trap:
How do you know what object relates to what value? The Value 0-10 fields are all the information about the sending server, the device that actually sends the trap. The Ent Value 0-3 fields are the OBJECTS being sent with the trap. Each object is referencing an OID, so you need to refer to the MIB to understand what the OID is (even though you can probably work it out from reading it).
Looking at Ent Value 0:
.1.3.6.1.4.1.20006.1.3.1.2
Refer to the picture below to understand what this OID means:
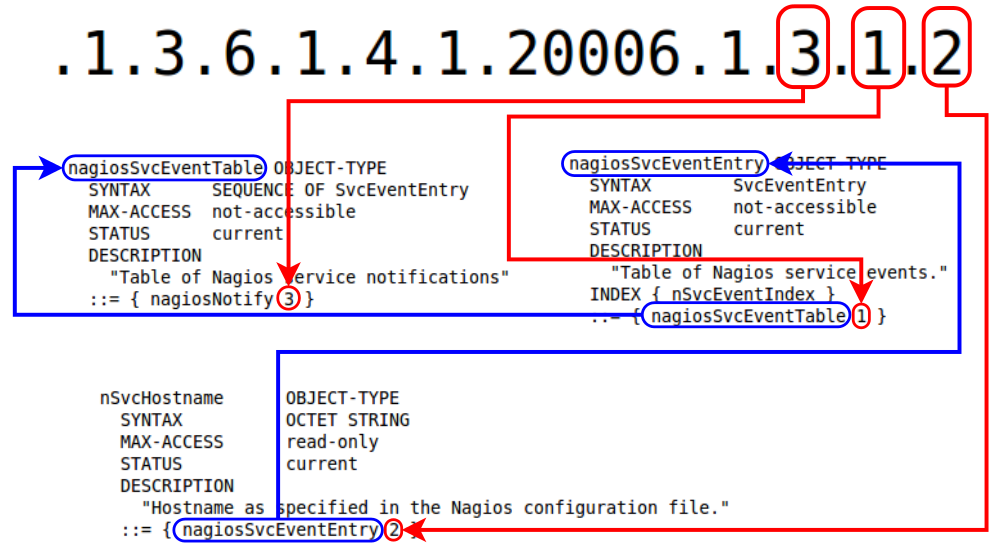
nSvcHostname
OID = .1.3.6.1.4.1.20006.1.3.1.2
Description = Hostname as specified in the Nagios configuration file.
Value = CentOS
So this is correct the, the trap was related to the CentOS server which had the hostname of CentOS
The other three values are:
nSvcDesc
OID = .1.3.6.1.4.1.20006.1.3.1.6
Description = This value is taken from the description directive of the service definition.
Value = Users
nSvcStateID
OID = .1.3.6.1.4.1.20006.1.3.1.7
Description = A number that corresponds to the current state of the service: 0=OK, 1=WARNING, 2=CRITICAL, 3=UNKNOWN
Value = 1
nSvcOutput
OID = .1.3.6.1.4.1.20006.1.3.1.17
Description = The text output from the last service check (i.e. Ping OK)
Value = USERS WARNING - 1 users currently logged in
What you have learned here is that from just one OID (.1.3.6.1.4.1.20006.1.7) information from any service monitored by the
sending Nagios XI server can be sent through to the receiving server.
That completes the section on OIDs and MIBs.
Sending Traps To Nagios XI
Remember how you uploaded the two MIB files into Nagios XI earlier? When uploading the NAGIOS-NOTIFY-MIB.txt file you selected the box to “Process trap”. What this did was:
- Read through the MIB file and find any SNMP Traps
- Add these traps to the snmptt configuration file
- /etc/snmp/snmptt.conf
- These traps are added as EVENTS to the new file
- EVENTS tell the SNMPTT service what to do with the SNMPT Trap
Have a look at the EVENTS that were created in the SNMPTT configuration. Primarily there were four EVENTs added to /etc/snmp/snmptt.conf however you are going to focus on services (.1.3.6.1.4.1.20006.1.7), below is the EVENT:
EVENT nSvcEvent .1.3.6.1.4.1.20006.1.7 "Status Events" Normal
FORMAT The SNMP trap that is generated as a result of an event with the service $*
EXEC /usr/local/bin/snmptraphandling.py "$r" "SNMP Traps" "$s" "$@" "$-*" "The SNMP trap that is generated as a result of an event with the service $*"
SDESC
The SNMP trap that is generated as a result of an event with the service
in Nagios.
Variables:
  1: nHostname
  2: nHostStateID
  3: nSvcDesc
  4: nSvcStateID
  5: nSvcAttempt
  6: nSvcDurationSec
  7: nSvcGroupName
  8: nSvcLastCheck
  9: nSvcLastChange
  10: nSvcOutput
EDESC
The first thing to explain is that everything between SDESC and EDESC is purely there as comments. It has no affect whatsoever on the notification to Nagios.
With that being the case, this leaves three lines remaining which are configurable:
EVENT
This line contains the OID which is matched against.
FORMAT
This line is what is logged in any log mechanisms that SNMPTT uses.
EXEC
This line is what sends the trap to Nagios. In this case it executes a python script and it is the python script that actually does the talking to Nagios.
One of the powerful features of SNMPTT is the ability to use variables, this way you can reference different objects in the trap itself. This allows you to make flexible configurations.
The EVENT line is broken up into four arguments separated by spaces:
EVENT nSvcEvent .1.3.6.1.4.1.20006.1.7 "Status Events" Normal
Argument #1 = Unique text label (alias) containing NO spaces
nSvcEvent
Argument #2 = The OID you want to match against
.1.3.6.1.4.1.20006.1.7
Argument #3 = Used when logging output, for your purposes "Status Events" is all that is required
"Status Events"
Argument #4 = Severity. This is used in the output and the logging and is also referenced as a variable ($s).
Normal
The FORMAT line is one long string and can contains variables.
FORMAT The SNMP trap that is generated as a result of an event with the service $*
In this example you can see that $* has been used, this is a variable
$* means it will expand all the variables (OBJECTS) that were sent with the trap
For example you can see in the picture below that it has logged the nSvcHostname, nSvcDescn, nSvcStateID, and nSvcOutput. This give you the string:
The SNMP trap that is generated as a result of an event with the service CentOS Users 1 USERS WARNING - 1 users currently logged in
The EXEC line is the command that will be executed.
SNMPTT is using the script /usr/local/bin/snmptraphandling.py which sends PASSIVE check results to the Nagios command pipe. It requires the following arguments:
<HOST> <SERVICE> <SEVERITY> <TIME> <PERFDATA> <DATA>
<HOST> = The host object in Nagios that this event is for
<SERVICE> = The service object in Nagios this event is for
<SEVERITY> = The state of the object, which can be INFORMATIONAL, NORMAL, SEVERE, MAJOR, CRITICAL, WARNING, MINOR (the script turns these into Nagios status codes 0/1/2/3)
<TIME> = The time which should be recored for the passive check
<PERFDATA> = Any performance data (can be left empty)
<DATA> = The useful status information
NOTE: It's important that each argument is enclosed in "double quotes".
The EXEC line added by default is:
/usr/local/bin/snmptraphandling.py "$r" "SNMP Traps" "$s" "$@" "$-*" "The SNMP trap that is generated as a result of an event with the service $*"
The arguments being sent also include variables which are explained below:
<HOST> = "$r"
"$r" = The hostname of the device that sent the trap to this server
<SERVICE> = "SNMP Traps"
The name of the service we are sending a Passive check for is "SNMP Traps"
<SEVERITY> = "$s"
"$s" = the SEVERITY defined in the EVENT line (in this case it is Normal)
<TIME> = "$@"
"$@" = the EPOCH value of when the trap was received
<PERFDATA> = "$-*"
$-* means it will expand all the variables (OBJECTS) that were sent with the trap in the format of "variable name (variable type):value"
nSvcHostname (OCTETSTR):CentOS nSvcDesc (OCTETSTR):Users nSvcStateID (INTEGER):0 nSvcOutput (OCTETSTR):USERS OK - 0 users currently logged in
<DATA> = "The SNMP trap that is generated as a result of an event with the service $*"
$* means it will expand all the variables (OBJECTS) that were sent with the trap (exactly the same as the FORMAT line)
When you put it all together what is actually being executed by the EXEC line is: (all in a SINGLE line, no line breaks like below)
/usr/local/bin/snmptraphandling.py "snmpsender" "SNMP Traps" "Normal" "1439269658" "nSvcHostname (OCTETSTR):CentOS nSvcDesc
(OCTETSTR):Users nSvcStateID (INTEGER):0 nSvcOutput
(OCTETSTR):USERS OK - 0 users currently logged in"
"The SNMP trap that is generated as a result of an event with the service CentOS Users 1 USERS WARNING - 1 users currently logged in"
When this EXEC statement is executed, Nagios XI will receive it and do one of two things:
IF there is already an “SNMP Traps” service for the host being targeted:
It will update that service and it will NOT log anything in nagios.log (this can be enabled)
IF there is NOT an “SNMP Traps” service for the host being targeted:
The following entries will be logged in nagios.log
[1416634449] Warning: Passive check result was received for service 'SNMP Traps' on host 'snmpsender', but the service could not be found!
[1416634449] Error: External command failed -> PROCESS_SERVICE_CHECK_RESULT;snmpsender;SNMP Traps;0;The SNMP trap that is generated as a result of an event with the service CentOS Users 1 USERS WARNING - 1 users currently logged in / nSvcHostname (OCTETSTR):CentOS nSvcDesc (OCTETSTR):Users nSvcStateID (INTEGER):0 nSvcOutput (OCTETSTR):USERS OK - 0 users currently logged in
[1416634449] External command error: Command failed
The "SNMP Traps" service will appear as an Unconfigured object under Admin > Monitoring Config > Unconfigured Objects
Below is a picture showing an SNMP Trap, the EVENT configuration in SNMPTT and the final result in Nagios XI:
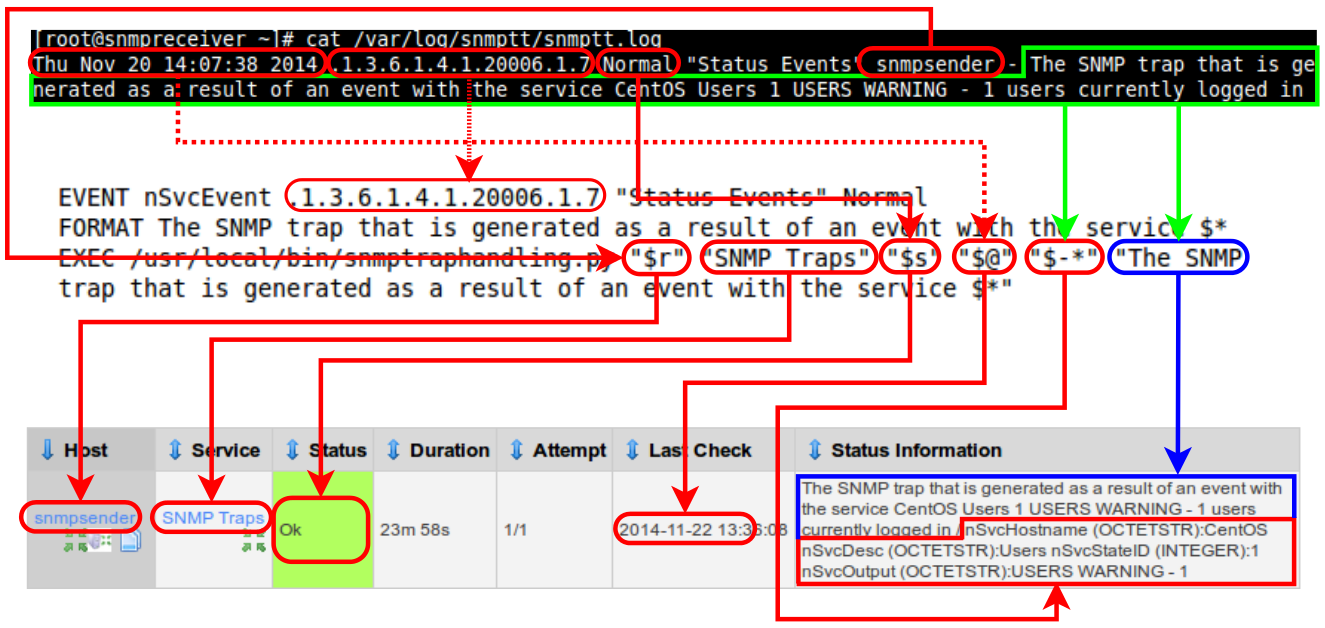
At this point you have been shown how SNMP Traps integrated into Nagios XI. You have also learned what an OID is and how to read a MIB file.
Create Custom Events In SNMPTT
The next step involves modifying the SNMPTT EVENTs to produce more meaningful data to be sent to Nagios XI. The goal here is to do the following:
- Multiple SNMP Trap services in Nagios XI to reflect each monitored service of the CentOS server
- Only send important information to Nagios XI (don't cloud the issue with too much information)
- Service status to be correctly reflected (OK / WARNING / CRITICAL / UNKNOWN)
The following steps will require you to edit the .conf files at the command line on the SNMP Receiving server. You will be instructed to use the command line editor called nano. Before we can use it we need to make sure it is installed:
Establish an SSH session to 10.25.5.30
Type:
yum -y install nano
Wait while nano is installed/updated
Leave the ssh session open as we'll be using it next
Now you will edit the /etc/snmp/snmptt.conf file:
Type:
nano /etc/snmp/snmptt.conf
Use the down arrow key until you reach the section EVENT nSvcEvent .1.3.6.1.4.1.20006.1.7 "Status Events" Normal
Change the FORMAT line so it is as follows:
FORMAT An SNMP trap received from a Nagios XI SERVICE with the details: $*
All that you have done here is to make the message that gets logged to snmptt.log a little more meaningful
Change the EXEC line so it is as follows:
EXEC /usr/local/bin/snmptraphandling.py "$1" "SNMP Trap - $2" "$s" "$@" "" "$4"
Press CTRL + X
Type:
Y
To save the changes
Press Enter to save the changes to the existing file
Type:
service snmptt restart
What does the EXEC line do now? It is using the values of the OBJECTS that exist in the trap. Here are the OBJECTS that exist in the trap:

In the SNMPTT config file, these values can be referenced as:
- Ent Value 0 = $1
- Ent Value 1 = $2
- Ent Value 2 = $3
- Ent Value 3 = $4
With this in mind, here's the new EXEC line broken down:
EXEC /usr/local/bin/snmptraphandling.py "$1" "SNMP Trap - $2" "$s" "$@" "" "$4"
<HOST> = "$1"
"$1" = CentOS
<SERVICE> = "SNMP Traps - $2"
The name of the service we are sending a Passive check for is "SNMP Traps - Users"
<SEVERITY> = "$s"
"$s" = the SEVERITY defined in the EVENT line (in this case it is Normal)
<TIME> = "$@"
"$@" = the EPOCH value of when the trap was received
<PERFDATA> = ""
NO performance data is being sent so we are providing empty quotes
<DATA> = "$4"
The status data we are sending is "USERS WARNING - 1 users currently logged in"
What you are doing down is sending a Passive check result for the service SNMP Traps - Users for the host CentOS. These will come through as an Unconfigured Object initially because Nagios XI has never received a Passive check result for this host/service.
Now send a trap and see how the service appears as in Nagios XI.
Establish an SSH session to your CentOS server
Minimize the SSH session as we only need it to establish a user login
Open a web page to http://10.25.5.20/nagiosxi
In the Search field at the top type:
CentOS
Click the Users service
Click the Schedule a forced immediate check link
Wait while it executes the check and the screen updates, it will go into a warning state
Open a web page to http://10.25.5.30/nagiosxi
Click the Admin menu heading
Under Monitoring Config click Unconfigured Objects
You should see something similar to the picture below:
To create the SNMP Trap - Users service:
In the Actions column click the Play button (Configure)
This opens the Passive Object Monitoring wizard at Step 3
Click Next
Click Finish
Wait while the wizard creates the SNMP Traps service
Click the link View status details for CentOS
You will see a picture similar to below:

Now you need to send another trap for the service to update, we'll come back to this screen shortly
Return to your SSH session to your CentOS server
Type:
exit
Return to the SENDING SNMP server and Schedule a forced immediate check for the Users service
Wait while it executes the check and the screen updates, it will go into an OK state
Return to the RECEIVING SNMP server and the SNMP Trap - Users service will now be updated like the picture below:

This reflects exactly what appears on the sending server (except we've pre-pended the service name with SNMP Trap -)
Now test the service going into a WARNING state
Establish an SSH session to your CentOS server
Minimize the SSH session as we only need it to establish a user login
Return to the SENDING SNMP server and Schedule a forced immediate check for the Users service
Wait while it executes the check and the screen updates, it will go into a Warning state
Return to the RECEIVING SNMP server and the SNMP Trap - Users service will now be updated like the picture below:

HOLD ON!!! Even though the Status Information says USERS WARNING the Status column is still Ok
Correct. You need to make some more changes to the /etc/snmp/snmptt.conf file before the service state will be reflected. This will be covered next.
This was intentional as part of the tutorial. You are being shown the configuration step by step so you understand each change you are making.
The way the service state is being reflected in Nagios is when we send the SEVERITY value using the "$s" variable. You define the SEVERITY as part of the EVENT line, in this case it is Normal. So right now all traps received for this OID will always be Normal as that is the defined SEVERITY.
What you can do is create MULTIPLE EVENTS in the /etc/snmp/snmptt.conf file for the SAME OID. Each EVENT will have a different SEVERITY value. So when the EXEC line sends the severity using the "$s" variable, the service will be reflected accordingly.
However HOW does SNMPTT know which EVENT to use when there are multiple events defined for the SAME OID? We can add an additional line to the EVENT config called a MATCH. A MATCH is an expression that must be evaluated to true for the trap to be considered a match to this EVENT definition.
In English, you are going to create three separate expressions:
- If the service state in the trap is 0 then it will be Normal
- If the service state in the trap is 1 then it will be Warning
- If the service state in the trap is 2 or 3 then it will be Critical
First look at the trap data:
As explained earlier, Ent Value 2 (nSvcStateID) = $3 and in the picture above the current state is 1 (Warning).
So the three separate MATCH expressions will be:
Ok
MATCH $3: 0
Warning
MATCH $3: 1
Critical or Unknown
MATCH $3: 2
MATCH $3: 3
An EVENT can have multiple MATCH statements. Because there isn't an Unknown SEVERITY we will use Critical for the Unknown service status's from Nagios.
In the next steps you will edit the /etc/snmp/snmptt.conf file and add the extra EVENT statements.
NOTE: Each EVENT is identical for the other except for the EVENT line and the MATCH line.
Return to the SSH session you have open on the RECEIVING SNMP server
Type:
nano /etc/snmp/snmptt.conf
Use the down arrow key until you reach the section EVENT nSvcEvent .1.3.6.1.4.1.20006.1.7 "Status Events" Normal
This EVENT line doesn't change as it is already Normal
After the EXEC line press Enter to start a new line
Type:
MATCH $3: 0
NOTE: This EVENT will only be executed if the service state of 0 exists in the trap in $3
Use the down arrow key until you go past the EDESC line
After the EDESC line press Enter twice
Add the following four lines:
EVENT nSvcEvent .1.3.6.1.4.1.20006.1.7 "Status Events" Warning
FORMAT An SNMP trap received from a Nagios XI SERVICE with the details: $*
EXEC /usr/local/bin/snmptraphandling.py "$1" "SNMP Trap - $2" "$s" "$@" "" "$4"
MATCH $3: 1
Note: This EVENT will only be executed if the service state of 1 exists in the trap in $3
After the MATCH line press Enter twice
Add the following five lines:
EVENT nSvcEvent .1.3.6.1.4.1.20006.1.7 "Status Events" Critical
FORMAT An SNMP trap received from a Nagios XI SERVICE with the details: $*
EXEC /usr/local/bin/snmptraphandling.py "$1" "SNMP Trap - $2" "$s" "$@" "" "$4"
MATCH $3: 2
MATCH $3: 3
This EVENT will only be executed if the service state of 2 or 3 exists in the trap in $3
Press CTRL + X
Type:
Y
To save the changes
Press Enter to save the changes to the existing file
Type:
service snmptt restart
Now you can do some tests to make sure it is working as expected.
Return to your SSH session to your CentOS server
Type:
exit
Return to the SENDING SNMP server and Schedule a forced immediate check for the Users service
Wait while it executes the check and the screen updates, it will go into an OK state
Return to the RECEIVING SNMP server and the SNMP Trap - Users service will now be updated like the picture below:
This reflects exactly what appears on the sending server, nothing new here.
Now test the service going into a WARNING state
Establish an SSH session to your CentOS server
Minimize the SSH session as we only need it to establish a user login
Return to the SENDING SNMP server and Schedule a forced immediate check for the Users service
Wait while it executes the check and the screen updates, it will go into a Warning state
Return to the RECEIVING SNMP server and the SNMP Trap - Users service will now be updated like the picture below:

Now it is correctly reflecting the Warning status. Now let's test Critical.
Establish an ADDITIONAL SSH session to your CentOS server
Minimize the SSH session as we only need it to establish a second user login
Return to the SENDING SNMP server and Schedule a forced immediate check for the Users service
Wait while it executes the check and the screen updates, it will go into a critical state
Return to the RECEIVING SNMP server and the SNMP Trap - Users service will now be updated like the picture below:

Now it is correctly reflecting the Critical status
At this point we have achieved the following:
- Only send important information to Nagios XI (don't cloud the issue with too much information)
- Service status to be correctly reflected (OK / WARNING / CRITICAL / UNKNOWN)
HOWEVER we still haven't done this:
- Multiple SNMP Trap services in Nagios XI to reflect each monitored service of the CentOS server
Throughout this tutorial you have seen that when a trap is received on a Nagios XI server AND it doesn't already exist as a service in Nagios XI, it will appear under the Unconfigured Objects. Once it appears there you can create the Passive service ready to accept new traps.
However they will only appear under Unconfigured Objects when the service changes state. So it might be a while before some are received.
If you wanted to create these services now you could actually go into Core Configuration Manager and make multiple copies of the “SNMP Trap - Users” service and rename each one to reflect the service being monitored on the sending service, like “SNMP Trap - CPU Stats”, “SNMP Trap - Yum Updates” etc. We'll not go through those steps here as this is easy to do.
Another way to do this is to disconnect the CentOS server from the network and by doing this all of the services will change their state. In addition to this you will see the host state of the CentOS server change on the SNMP Receiving server (or will it?).
Open a console session to your CentOS VM
Login to the console as root
Type:
ifdown eth0
Open a web page to http://10.25.5.20/nagiosxi
In the Search field at the top type:
CentOS
Click the host object CentOS (the word CentOS)
Under Quick Actions click Schedule a forced immediate check
Click the Advanced tab
Under Commands click Schedule immediate check for all services on this host
Click Commit
Click Done
In the Search field at the top type:
CentOS
Here you will see something similar to the picture below:
Now a trap for each of these services has been sent through to the RECEIVING SNMP server
Open a web page to http://10.25.5.30/nagiosxi
Click the Admin menu heading
Under Monitoring Config click Unconfigured Objects
You should see something similar to the picture below:
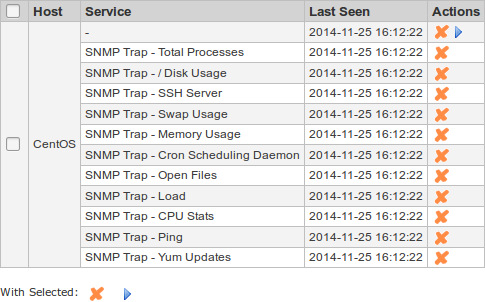
To create all these SNMP Trap - xxx services:
Tick the box next to CentOS
At the bottom next to With Selected click the Play button (Configure)
This opens the Passive Object Monitoring wizard at Step 3
Click Next
Click Finish
Wait while the wizard creates the SNMP Traps service
Click the link View status details for CentOS
Now you will have all the SNMP Trap - xxx services created
Now you can bring the CentOS server online and all of these services will be updated
Return to the console session to your CentOS VM
Type:
ifup eth0
Open a web page to http://10.25.5.20/nagiosxi
In the Search field at the top type:
CentOS
Click the host object CentOS (the word CentOS)
Under Quick Actions click Schedule a forced immediate check
Click the Advanced tab
Under Commands click Schedule immediate check for all services on this host
Click Commit
Click Done
Open a web page to http://10.25.5.30/nagiosxi
In the Search field at the top type:
CentOS
Here you will see something similar to the picture below:
Now you have all the SNMP Trap services receiving data for the CentOS host
HOLD ON!!! What about the CentOS host object? It is still grey in the pending state.
If you click on the host object CentOS (the word CentOS) you'll see it says Host check is pending...
- This is because the SNMP Traps that arrive for the HOST object come in on a different OID!
- HOST traps use the OID .1.3.6.1.4.1.20006.1.5
The last part of this tutorial will be to add the EVENT statements to the /etc/snmp/snmptt.conf file. This will ensure that the HOST object also gets it's status updated.
Return to the SSH session you have open on the RECEIVING SNMP server
Type:
cat /var/log/snmptt/snmptt.log | grep .1.3.6.1.4.1.20006.1.5
The last line will be similar to the picture below:
![]()
This is showing you the trap received for the HOST object.
Type:
nano /etc/snmp/snmptt.conf
Use the down arrow key until you reach the section EVENT nHostEvent .1.3.6.1.4.1.20006.1.5 "Status Events" Normal
This EVENT line doesn't change as it is already Normal
Change the FORMAT line so it is as follows:
FORMAT An SNMP trap received from a Nagios XI HOST with the details: $*
All that you have done here is to make the message that gets logged to snmptt.log a little more meaningful
Change the EXEC line so it is as follows:
EXEC /usr/local/bin/snmptraphandling.py "$1" "PROCESS_HOST_CHECK_RESULT" "$s" "$@" "" "$3"
After the EXEC line press Enter to start a new line
Type:
MATCH $2: 0
This EVENT will only be executed if the host state of 0 exists in the trap in $2
Use the down arrow key until you go past the EDESC line
After the EDESC line press Enter twice
Add the following six lines:
EVENT nHostEvent .1.3.6.1.4.1.20006.1.5 "Status Events" Critical
FORMAT An SNMP trap received from a Nagios XI HOST with the details: $*
EXEC /usr/local/bin/snmptraphandling.py "$1" "PROCESS_HOST_CHECK_RESULT" "$s" "$@" "" "$3"
MATCH $2: 1
MATCH $2: 2
MATCH $2: 3
This EVENT will only be executed if the host state of 1 or 2 or 3 exists in the trap in $2
Press CTRL + X
Type:
Y
to save the changes
Press Enter to save the changes to the existing file
Type:
service snmptt restart
Now you can do some tests to make sure it is working as expected.
Return to the console session to your CentOS VM
Type:
ifdown eth0
Open a web page to http://10.25.5.20/nagiosxi
In the Search field at the top type:
CentOS
Click the host object CentOS (the word CentOS)
Under Quick Actions click Schedule a forced immediate check
Wait while it executes the check and the screen updates, it will go into a critical state
Open a web page to http://10.25.5.30/nagiosxi
In the Search field at the top type:
CentOS
Here you will see that the HOST object CentOS is now in a Critcal state and the color is red
Return to the console session to your CentOS VM
Type:
ifup eth0
Within a minute or so the everything should return back to an OK state on the RECEIVING SNMP server. The host object now has a green background, similar to the picture below:
Congratulations, you've now completed the SNMP Trap Tutorial.
SNMP Trap Tutorial - Summary
While the S in SNMP stands for Simple, you've seen how it can be hard to learn SNMP. Hopefully this tutorial has helped break down some of these barriers.
At this point you should have a good understanding of how SNMP Traps are received and handled by Nagios XI.
Armed this this knowledge you will now be able to setup Nagios XI to receive SNMP Traps from various SNMP enabled devices on your network.
Final Thoughts
For any support related questions please visit the Nagios Support Forums at:


