;)

;)
;)

;)
;)
;)

;)
;)
;)
;)
;)
;)
;)
;)
;)
;)
;)
;)
;)

;)
;)
;)
;)
;)
;)
;)
;)
;)
;)
;)
;)
;)
;)
;)
;)
;)
;)
;)
;)
;)
;)

Overview
This KB article shows you how to monitor a Nagios Log Server cluster using the Nagios Cross-Platform Agent (NCPA) and Nagios XI.
Note: Images in this article use the Nagios XI dark theme to help distinguish between XI and Log Server. Webpages may not look the same if you are using a different theme.
Requirements
This KB article assumes that you have:
- Nagios Log Server >= 2.1.0
- Nagios XI (any version) with NCPA Wizard version >= 2.2.0 (shipped with XI 5.7+)
- A valid network connection between these servers
Managing the Agent
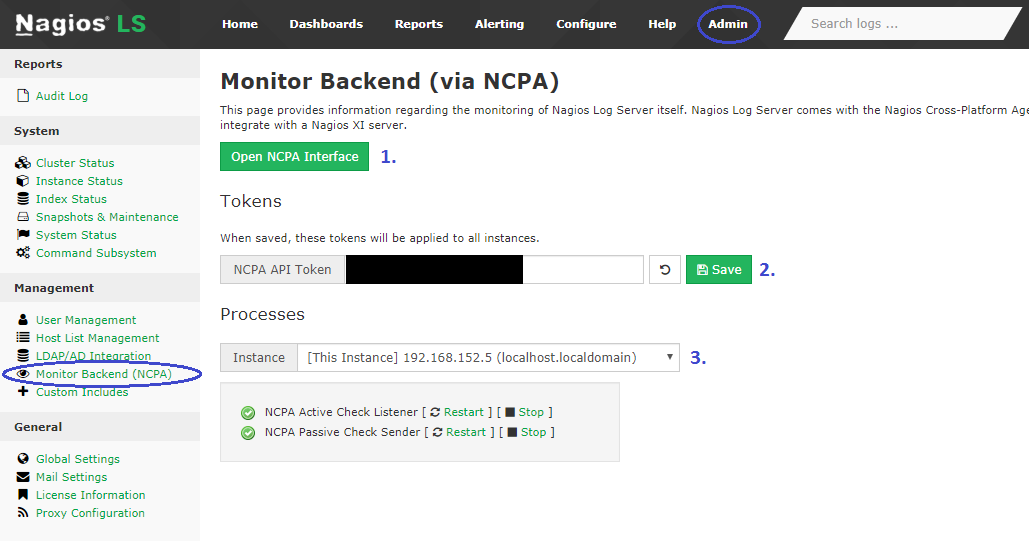
The Nagios Cross-Platform Agent (NCPA) now ships by default with Nagios Log Server. A specialized management page is also available, at Admin > Management > Monitor Backend (NCPA).
On the page you should see 3 sections:
1. At the top, a button labelled Open NCPA Interface. This will open the main web interface for the agent.
2. A token management form.
Setting the token with this form will allow you to apply the same token to every agent on the cluster with one click.
If you're using HTTPS, make sure that you've accepted the certificate in your browser, otherwise this will only work for the current machine.
3. The process list.
At the bottom, you will see a display that allows you to view and manage the NCPA processes for all members of the cluster.
You can switch the viewed instance by clicking the drop-down menu labelled Instance.
Monitoring
To monitor the NLS cluster, go to your Nagios XI Interface, and go to Configure > Configuration Wizards > NCPA.
Most of this configuration wizard should be self-explanatory. However, at the bottom of the second page there is now a Plugins section which is needed for monitoring NLS.
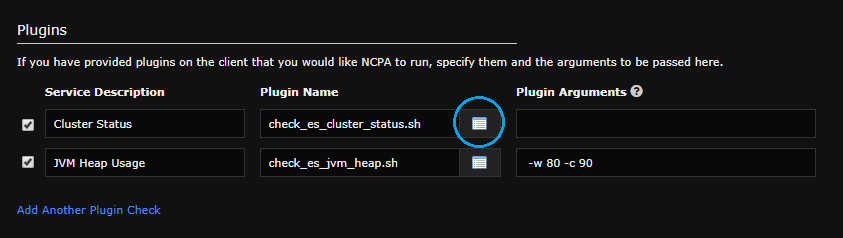
To select a plugin, click the list icon to the right of the second box.
If check_es_cluster_status.sh is selected, Plugin Arguments should be left blank.
This plugin simply checks the Elasticsearch cluster status, and alerts OK/WARNING/CRITICAL based on whether status is GREEN/YELLOW/RED. Since 1-instance clusters YELLOW at best, these will also output an OK status.
If check_es_jvm_heap.sh is selected, warning and critical thresholds should be specified in the usual way, and expressed as a percentage of the total desired elasticsearch JVM heap usage. For instance, you may choose arguments like:
-w 80 -c 90
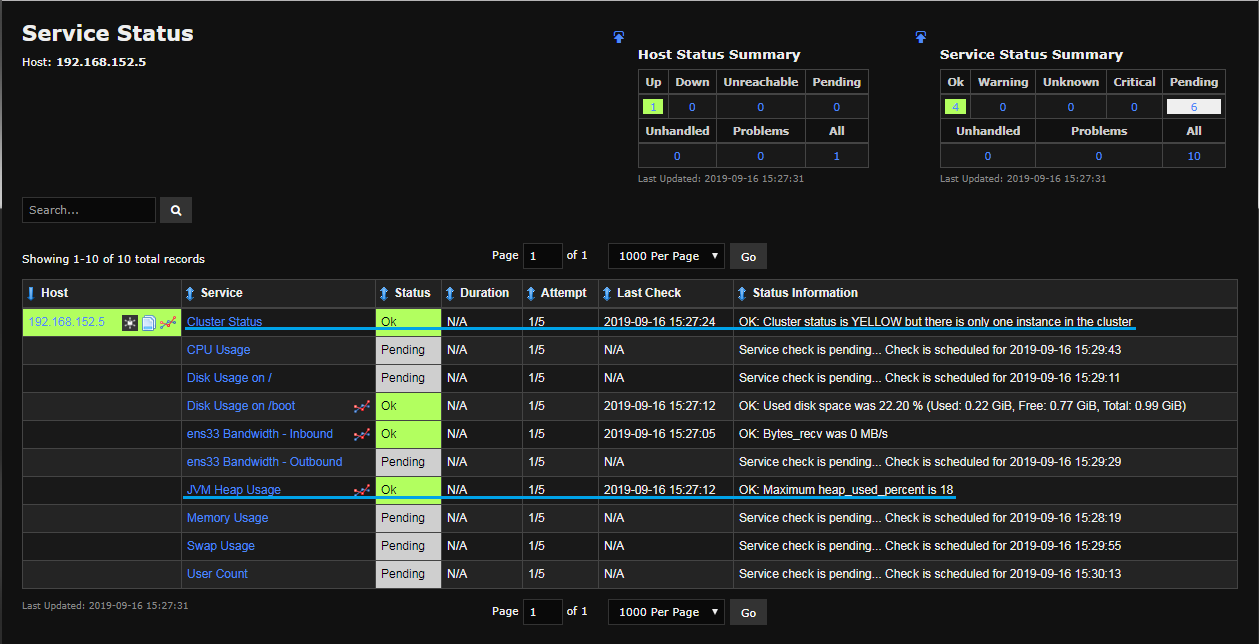
When finished, click the Next button until configuration is applied. If you've done everything correctly, you should see the normal NCPA service status alongside the custom plugins:
Final Thoughts
For any support related questions please visit the Nagios Support Forums at:


