;)

;)
;)

;)
;)
;)

;)
;)
;)
;)
;)
;)
;)

;)
;)
;)
;)
;)
;)
;)
;)
;)
;)
;)
;)

Problem Description
Nagios Log Server is in a yellow health state. You can see the current cluster state by navigating to Admin > System > Cluster Status:
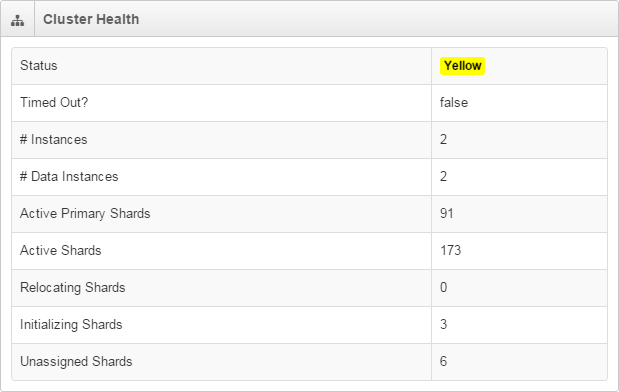
The cluster can be in one of three states:
Green: All primary and replica shards are active and assigned to instances.
Yellow: All data is available but some replicas are not yet allocated (cluster is fully functional).
Red: There is at least one primary shard that is not active and allocated to an instance (cluster is still partially functional).
Potential Causes
What can cause a shard to become unassigned/corrupt?
-
Unexpected reboots or shutdowns - an unexpected reboot or shutdown of any instance in your cluster can cause a primary shard to become detached or corrupt. In most cases, Elasticsearch will recover from this problem on its own.
-
Disk space fills up - if Nagios Log Server runs out of disk space, serious complications can occur. Typically this results in corrupt/unassigned shards.
Note: Disk space will need to be increased, or existing Log Server data will need to be removed.
-
Out of memory error - if Elasticsearch takes up too much system memory, the kernel could reap Elasticsearch. You will see an explicit message in /var/log/messages at the time this occurs. The sudden reaping of Elasticsearch could cause corrupt/unassigned shards.
Note: Memory will likely need to be increased on Nagios Log Server before restart - otherwise you risk Elasticsearch being reaped again.
- You only have one node in your Log Server cluster
-
Nagios Log server is a cluster based application, and requires more than one node in the cluster for Log Server to see it as "healthy".
- When there is only one node in the cluster:
-
The status will always be Yellow
-
Unassigned Shards will never be 0 as they are waiting to be assigned to another node in the cluster (which does not exists)
-
-
If you wish to deploy a single instance cluster please refer to the following documentation:
-
Troubleshooting Disk Space
Run the following commands on EVERY instance in the cluster:
Type:
grep watermark /var/log/elasticsearch/*.log
We are looking for output like this:
[2016-02-15 03:20:31,927][INFO ][cluster.routing.allocation.decider]
[84b9dd98-e004-43ee-b70a-a5e48f8482cc] low disk watermark [85%]
exceeded on [cP-M7p_XQCGj_lUYvKnWOw][3e2220f4-1a3b-437b-a939-cf269b8e785c]
free: 38.1gb[12.9%], replicas will not be assigned to this node
The message is telling us that we have used more than 85% of the available disk space.
Check the amount of available disk space:
df -h
Which output this:
Filesystem            Size  Used Avail Use% Mounted on
rootfs                296G  255G   39G  87% /
devtmpfs              3.9G  148K  3.9G   1% /dev
tmpfs                 4.0G     0  4.0G   0% /dev/shm
/dev/sda1             296G  255G   39G  87% /
Here you can see that the rootfs has 87% disk space used which confirms the problem.
Resolving Disk Space
You have two options:
Add more disk space
This is most likely the course of action you need to take. Once you've added the disk space, if the custer health does not return to green, restart the elasticsearch service on that instance:
systemctl restart elasticsearch.service
Wait about 5 minutes and the cluster health should return to green.
This documentation will help if you want to move the data location:
Documentation - Changing Data Store Path
Increase The Low/High Watermark
The default watermark level is set to 85% of the disk that the elasticsearch data is located on. If you have a much larger disk, you may want to increase this to 90% or more.
Note: The watermark is a cluster-wide setting.
The command to adjust the LOW watermark is:
curl -s -XPUT http://localhost:9200/_cluster/settings -d '{ "persistent" : { "cluster.routing.allocation.disk.watermark.low" : "90%" } }'
The command to adjust the HIGH watermark is:
curl -s -XPUT http://localhost:9200/_cluster/settings -d '{ "persistent" : { "cluster.routing.allocation.disk.watermark.high" : "95%" } }'
Which will output similar to the following:
{"acknowledged":true,"persistent":{"cluster":{"routing":{"allocation":{"disk":{"watermark":{"low":"90%"}}}}}},"transient":{}}
Then restart the elasticsearch service on that instance:
systemctl restart elasticsearch.service
Wait about 5 minutes and the cluster health should return to green.
Final Thoughts
For any support related questions please visit the Nagios Support Forums at:


