;)

;)

;)
;)

;)
;)
;)
;)
;)
;)
;)
;)
;)
;)
;)
;)
;)
;)
;)
;)
;)
;)

;)
;)
;)
;)
;)
;)
;)
;)
;)
;)
;)
;)
;)
;)
;)
;)
;)

Overview
Nagios XI has dashlets called Gauges that appear on the Performance Graphs tab of a host or service details.
Here is an example of the gauges that appear for a bandwidth service:
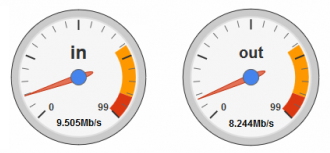
On the guages that appear above, you can see the warning color appears at about 70 and the critical color at 90, maxing out at 99.
In this scenario, the original service was configured with the following thresholds in the check command:
check_command check_xi_service_mrtgtraf!10.8.30.3_13.rrd!70.00,70.00!90.00,90.00!M
Basically it was configured as a 100 MB service when the Network Switch / Router Wizard was originally run.
The gauges correspond to the thresholds defined for the host or service object.
Changing Gauge Thresholds
What if the link you were monitoring was a 20MB link, how do you get the gauges to correctly reflect this?
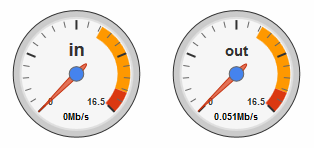
You need to updated the service definition to have correct warning and critical thresholds. With a 20MB link you may want warning to be set to 10 and the critical set to 15.
Open Core Configuration Manager and update the service to reflect these thresholds, for example:
check_command check_xi_service_mrtgtraf!10.8.30.3_13.rrd!10.00,10.00!15.00,15.00!M
This would be defined in the $ARG2$ and $ARG3$ fields for the service.
Save the changes and Apply Configuration. You will need to wait until the service has been checked before the gauges are updated. Here is an example of the gauges that reflect these changes:
Further Information
The example shown in this KB article was for a bandwidth service that was created using the Network Switch / Router wizard, however gauges are not limited to just those types of objects.
As long as your host or service definition has the correct relative warning and critical thresholds then the gauges will correctly reflect these.
Final Thoughts
For any support related questions please visit the Nagios Support Forums at:

