;)

;)
;)

;)
;)
;)

;)
;)
;)
;)
;)
;)
;)
;)
;)
;)
;)
;)
;)
;)
;)
;)
;)
;)

;)
;)
;)
;)
;)
;)
;)
;)
;)
;)
;)
;)
;)
;)
;)
;)
;)

Third-Party Plugins
Overview
This is an article on how to install an example 3rd-party plugin on the XI server and details on creating the command and arguments in the Core Config Manager.
This document also describes how to manage plugins on your Nagios XI system, including: finding and installing new plugins, defining commands, and using them in your services.
Note: Not all plugins that are available have the instructions for creating the commands and which arguments they need to run.
Finding and Installing New Plugins
The plugin chosen for the example is the check_snmp_lmsensors.pl
Downloaded here:
https://exchange.nagios.org/directory/Plugins/Network-Protocols/SNMP/check_snmp_lmsensors/details
- The plugin is used to measure the CPU temperature and Fan speed of a remote linux system using SNMP.
- It requires the remote system have the net-snmp package installed and the snmpd daemon configured and running.
- It also requires the lm_sensors package installed and configured.
After you download the plugin and upload it to the XI server using the Admin > Manage Plugins menu, you need to run it from the command line to determine what the plugin needs to run and to use that information to create the command.
Most plugins have a help option you can run to view what sort of arguments it needs.
Example of running the help option:
/usr/local/nagios/libexec/check_snmp_lmsensors.pl -h
Note: Uploading the plugin does not create a command in Nagios.
Here is the output of the plugin:
Can't locate Nagios/Plugin.pm in @INC (you may need to install the Nagios::Plugin module)
(@INC contains: /usr/local/lib64/perl5 /usr/local/share/perl5 /usr/lib64/perl5/vendor_perl /usr/share/perl5/vendor_perl /usr/lib64/perl5 /usr/share/perl5)
at /usr/local/nagios/libexec/check_snmp_lmsensors.pl line 20.
BEGIN failed--compilation aborted at /usr/local/nagios/libexec/check_snmp_lmsensors.pl line 20.
That message means that the plugin has a requirement needed to run. It needs a perl module installed on the Nagios server called Nagios::Plugin but that module is obsolete and has been replaced with a new one called Nagios::Monitoring::Plugin.
Edit the plugin and change the following from
use Nagios::Plugin;
my $p = Nagios::Plugin->new(
to
use Nagios::Monitoring::Plugin;my $p = Nagios::Monitoring::Plugin->new(
Save the change. Run with the help option:
/usr/local/nagios/libexec/check_snmp_lmsensors.pl -hNow the help option produces this as the output:
This nagios plugin is free software, and comes with ABSOLUTELY NO WARRANTY.
It may be used, redistributed and/or modified under the terms of the GNU
General Public Licence (see http://www.fsf.org/licensing/licenses/gpl.txt).
This plugin checks the given sensor (Fan or Temp) on the remote
 host with snmp and will output OK, WARNING or CRITICAL if the resulting number
 is between the specified thresholds. Remote host needs lmsensors-enabled net-snmpd.
Usage: check_snmp_lmsensors.pl [ -v|--verbose ] [-H <host>] [-t <timeout>]
 [ -C|--community=<COMMUNITY NAME> ] [ -s|--sensor=<Temp> or <Fan> ]
 [ -i|--index=<sensor index> ]
 [ -c|--critical=<critical threshold> ] [ -w|--warning=<warning threshold> ]
-?, --usage
 Print usage information
 -h, --help
 Print detailed help screen
 -V, --version
 Print version information
 --extra-opts=[section][@file]
 Read options from an ini file. See https://nagios-plugins.org/doc/extra-opts.html
 for usage and examples.
 -w, --warning=INTEGER,[INTEGER]
 Maximum number of allowable result, outside of which a
 warning will be generated. If omitted, no warning is generated.
 -c, --critical=INTEGER,[INTEGER]
 Maximum number of the generated result, outside of
 which a critical will be generated.
 -s, --sensor=STRING
 Specify the Sensortype on the command line. Use Temp or Fan.
 -i, --index=INTEGER
 Specify the Sensor numbers on the command line.
 -C, --community=STRING
 Specify the community name on the command line.
 -H, --host=STRING
 Specify the host on the command line.
 -t, --timeout=INTEGER
 Seconds before plugin times out (default: 15)
 -v, --verbose
 Show details for command-line debugging (can repeat up to 3 times)
 THRESHOLDs for -w and -c are specified 'min:max' or 'min:' or ':max'
 (or 'max'). If specified '@min:max', a warning status will be generated
 if the count *is* inside the specified range.
Examples:
check_snmp_lmsensors -w 10 -c 18 Returns a warning
 if the resulting number is greater than 10,
 or a critical error
 if it is greater than 18.
check_snmp_lmsensors -w 10 : -c 4 : Returns a warning
 if the resulting number is less than 10,
 or a critical error
 if it is less than 4.
In the usage section of the help, you will see the options that are needed for the plugin to run.
The following are the minimal options that are needed to run the plugin.
[-H <host>]
[ -C|--community=<COMMUNITY NAME> ]
[ -s|--sensor=<Temp> or <Fan> ]
[ -i|--index=<sensor index> ]
[ -c|--critical=<critical threshold> ]
[ -w|--warning=<warning threshold> ]
Defining the Command
To create a command in XI so go to the Core Config Manager > Commands menu and add a new command.
Name the command: check_snmp_lmsensors
And for the Command line, we will define it like the following:
$USER1$/check_snmp_lmsensors.pl -H $HOSTADDRESS$ -C $ARG1$ -s $ARG2$ -i $ARG3$ -w $ARG4$ -c $ARG5$ $ARG6$Make it active and save the command and apply the config.
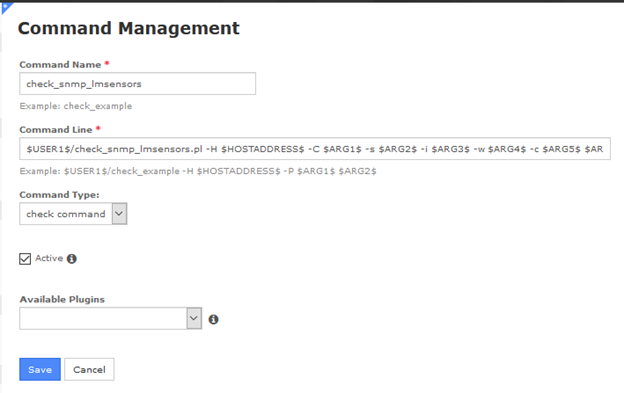
- $ARG1$ will be used for the plugins Community String.
- $ARG2$ will be used for the plugins Sensor type. Fan or Temp.
- $ARG3$ will be used for the plugins index to which Fan or Temperature we want to monitor.
- $ARG4$ will be used for the plugins Warning Threshold.
- $ARG5$ will be used for the plugins Critical Threshold.
- $ARG6$ will be used for any miscellaneous arguments that may be needed in the future.
See this link for more details on how ARGx are used in commands and checks.
https://assets.nagios.com/downloads/nagioscore/docs/nagioscore/4/en/macros.html#arg
Using in Services
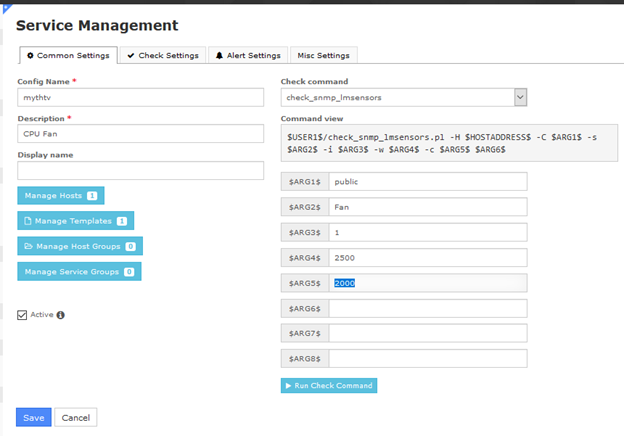
Create a Service by going to the Core Config Manager > Services menu.
Give it a Config Name. Typically, it is the name of the host we are monitoring.
This service is going to monitor the CPU temperature so the Description used is called CPU Temperature.
Click on the Manage Hosts button and select the host and then click on the Manage Templates and select a template you want to use.
Check the Active box to make the check active.
For the Check Command, we will select the command check_snmp_lmsensors
- In $ARG1$ fill in the Community string of the remote server that we are monitoring
- In $ARG2$ is the Sensor we are monitoring which will be Temp.
- In $ARG3$ is the sensor index for the CPU temp which is 1.
- In $ARG4$ is the temperature warning threshold.
- In $ARG5$ is the temperature warning threshold.
- In $ARG6$ will be left blank.
Save the Service and Apply the Config.

To monitor a Fan, most of the settings will be the same, so copy the Temperature service and edit the Description.
- Call it CPU Fan.
- Change $ARG2$ to Fan which is the Sensor Type.
- The Threshold settings will have to be adjusted as well.
Save the Service and Apply the Config.
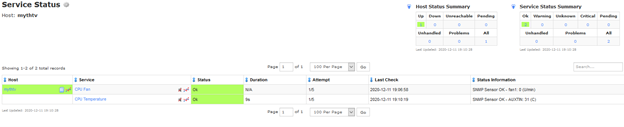
After a few minutes, go to the Home > Host Status menu and select the Host and show it's services.
Here you will see the Status of the CPU Temperature and Fan for the newly created service checks.