;)

;)
;)

;)
;)
;)

;)
;)
;)
;)
;)
;)
;)
;)
;)
;)
;)
;)
;)
;)
;)
;)
;)
;)

;)
;)
;)
;)
;)
;)
;)
;)
;)
;)
;)
;)
;)
;)
;)
;)
;)

Monitoring Linux using NCPA
Overview
Before you can use the instructions outlined in this document, you must first install NCPA on the target Windows / Linux / AIX / Mac OS X machine you wish to monitor. Instructions for installing NCPA can be found in the Installing NCPA documentation.
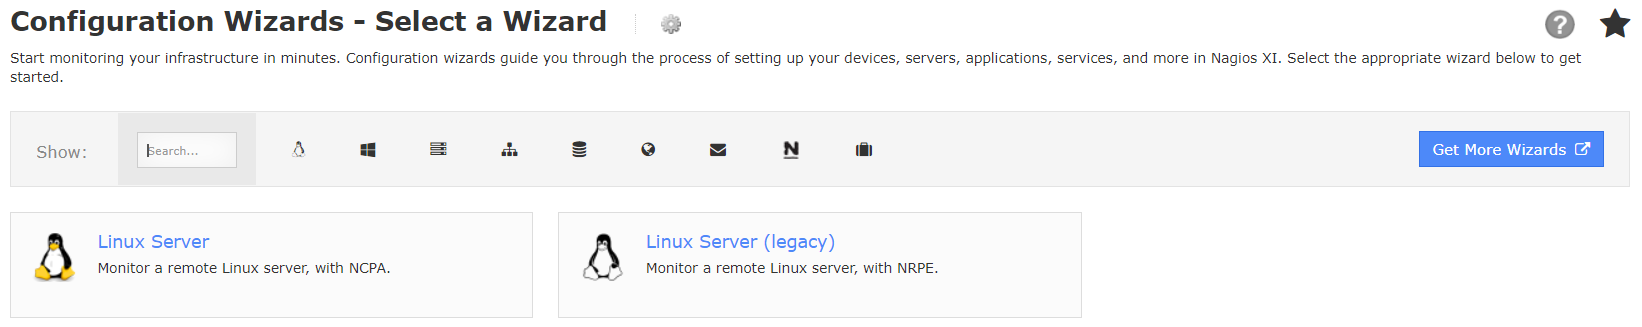
Using The Linux Server Wizard
To begin using the NCPA Agent wizard navigate via the top menu bar to Configure > Configuration Wizards and select the Linux Server wizard. In the following screenshot you can see how the search field allows you to quickly find a wizard.


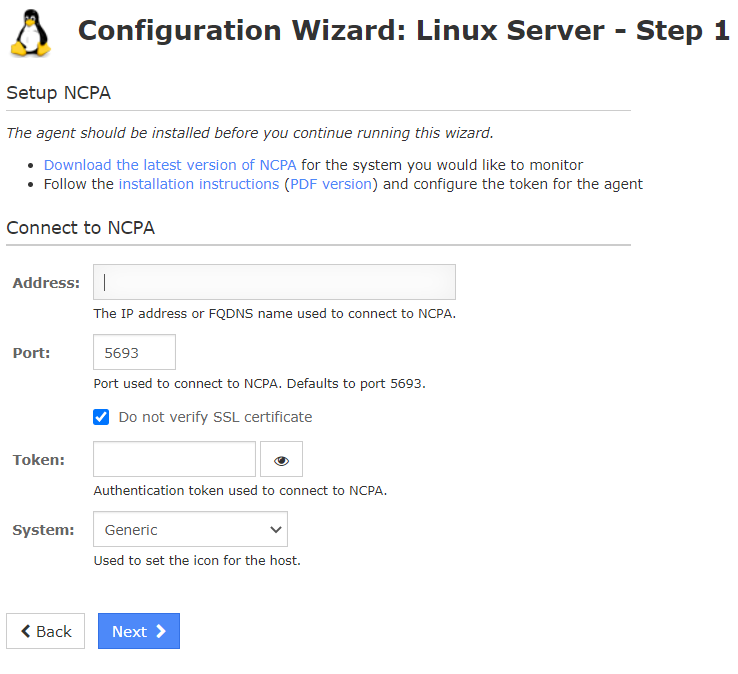
Step 1
-
Type the address or FQDNS name of the host you want to monitor.
-
You can specify the port number if you have changed it from the default of 5693.
-
Type the Token you are using on the NCPA agent.
-
Choose the system type of the host you want to monitor.
-
Click Next .
Step 2

On this step you will configure all of the options for monitoring. In the screenshot you can see some of the options available.
-
Enter a valid Host Name .
-
Select the metrics that you'd like to monitor.
-
You can adjust the warning and critical thresholds for each metric to suit your needs.
-
Click Next once you have selected all the required options.
Complete the wizard by choosing the required options in Step 3 – Step 5 .
To finish up, click on Finish in the final step of the wizard. This will create the new host and services and begin monitoring.
Once the wizard applies the configuration, click the View status details for <NCPA HOST> link to see the new service that was created.


