;)

;)
;)

;)
;)
;)

;)
;)
;)
;)
;)
;)
;)
;)
;)
;)
;)
;)
;)
;)
;)
;)
;)
;)

;)
;)
;)
;)
;)
;)
;)
;)
;)
;)
;)
;)
;)
;)
;)
;)
;)

Monitoring Office 365 Subscription Services
Overview
You can now monitor your Microsoft Office 365 subscription services with Nagios XI. Metrics such as Mailbox Usage, Group Activity, and Product Usage are now visible and thresholds can be configured so that you are alerted to any critical or warning events in your Office 365 environment.
Before you can use the instructions outlined in this document, you must first obtain the following information from your Microsoft Office 365/Entra administrator:
- Application (client) ID (GUID) created during plugin registration in Microsoft Entra.
- Directory (tenant) ID (GUID), of your organization or domain.
- Client secret - plugin authentication credentials, created in Microsoft Entra.
Notes for Administrators:
- Directory.Read.All
- Group.Read.All
- Reports.Read.All
- User.Read.All
- In the Microsoft Entra admin center, create an App Registration with a friendly name, like "Nagios". Note the Application (client) ID and Directory (tenant) ID listed on the Overview tab.
- Go to API Permissions and add permissions.
- Select/click on Microsoft Graph.
- Select "Application Permissions" type.
- Select the following:
- i. Directory -> Directory.Read.All
- ii. Group -> Group.Read.All
- iii. Reports -> Reports.Read.All
- iiii. User -> User.Read.All
- Click "Update permissions"
- Click "Grant admin consent for [tenant name]" (you must be a Global Administrator) to approve.
- Go to "Certificates & secrets" tab and add a new Client Secret (select desired expiration).
- Note (copy/save) the Secret value. This will be the only time you will be able to see the entire value.
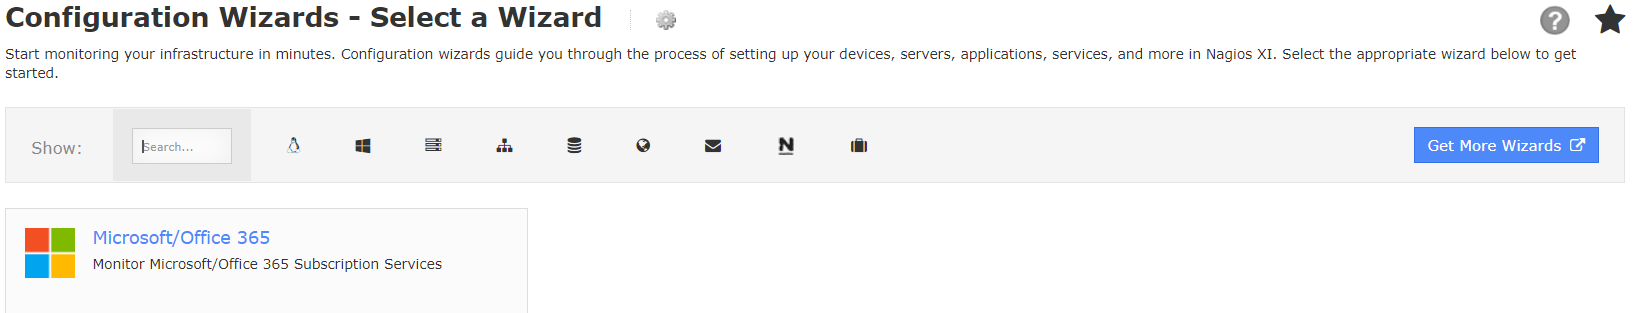
Using The Microsoft/Office 365 Wizard
To begin using the Microsoft/Office 365 wizard navigate via the top menu bar to Configure > Configuration Wizards and select the Microsoft/Office 365 wizard. In the following screenshot you can see how the search field allows you to quickly find a wizard.


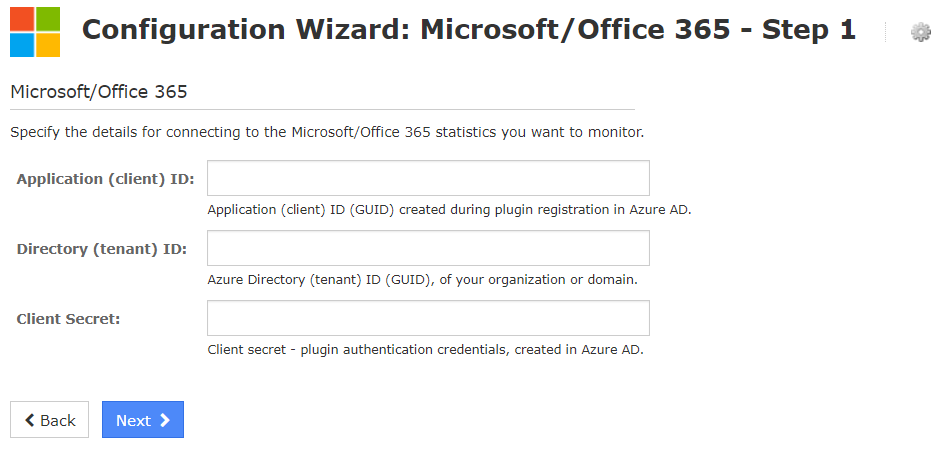
Step 1
-
Enter the Application (client) ID.
-
Enter the Directory (tenant) ID.
-
Enter the Client Secret.
-
Click Next.
Step 2
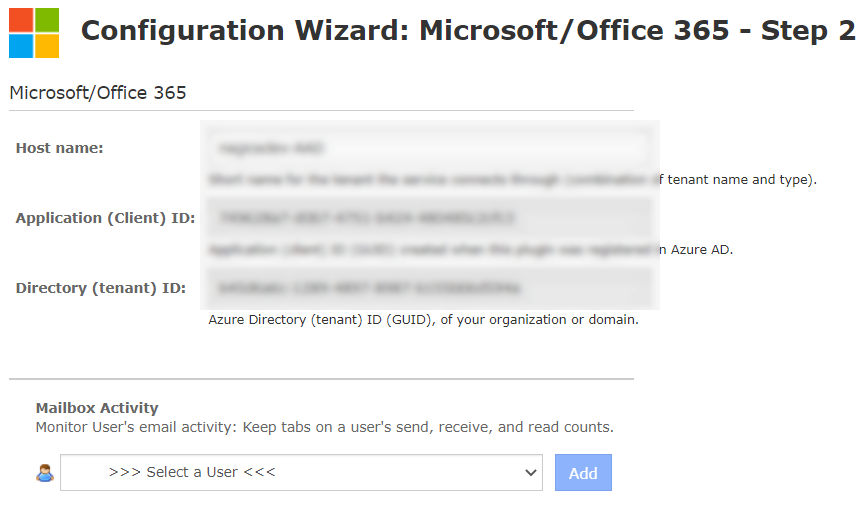

On this step you will configure all of the options for monitoring. In the screenshot you can see some of the options available.
-
Enter a valid Host Name.
-
Select the metrics that you'd like to monitor. You can monitor the following:
-
- Mailbox Activity (by User)
- Mailbox Usage (by User)
- Mailbox Counts
- Office 365 User Activations (by User)
- Office 365 Activations (by Product Type)
- Office 365 User Product Usage
- Office 365 User Service Usage
- Office 365 Group Activity (by Group)
- Office 365 Group Files
-
-
You can adjust the warning and critical thresholds for each metric to suit your needs. Note: See Definitions of threshold and range syntax.
-
Click Next once you have selected all the required options.
Complete the wizard by choosing the required options in Step 3 – Step 5.
To finish up, click on Finish in the final step of the wizard. This will create the new host and services and begin monitoring.
Once the wizard applies the configuration, click the View status details for <Office 365 HOST> link to see the new services that were created.


